
What the AAO Process Flow Diagram Looks Like
The AAO (Anaerobic-Anoxic-Oxic, also called A2O) process flow diagram sequences three biological reactors — anaerobic → anoxic → aerobic — followed by a clarifier, with an internal mixed-liquor recycle from the aerobic to the anoxic zone (typically 200–400% of influent flow) and a return activated sludge (RAS) line back to the anaerobic head. The anaerobic zone releases phosphorus, the anoxic zone denitrifies using the recycled nitrate, and the aerobic zone nitrifies ammonia and luxury-uptakes phosphorus, achieving simultaneous BOD, TN, and TP removal in roughly 90% of biological nutrient-removal plants worldwide.
Reading the diagram from left to right, the train runs: Influent → screening and grit removal → anaerobic tank → anoxic tank → aerobic tank (with diffused-aeration grid) → secondary clarifier → disinfection → effluent. Two closed loops distinguish AAO from a plain A/O scheme. The first is RAS, drawn from the clarifier underflow back to the head of the anaerobic zone at 50–100% of influent flow. The second is the mixed-liquor recycle (often labeled "R" on P&IDs), drawn from the aerobic outlet back to the anoxic inlet at 200–400% of influent flow — it is the engine that closes the nitrogen loop.
Two side streams leave the train. Waste activated sludge (WAS) bleeds from the RAS line to sludge handling; its flow rate sets the sludge age. An optional fermenter or sludge-stripping sidestream recycles volatile fatty acids (VFAs) to the anaerobic zone to boost carbon when the influent BOD is weak. Upstream protection begins at the headworks, where a rotary mechanical bar screen such as the GX-series rotary bar screen removes rags and grit that would otherwise accumulate in the anaerobic tank and short-circuit flow. The diagram below is the spine of any A2O P&ID; every instrument loop, recycle pump, and DO probe maps back to one of these blocks.
The Anaerobic Zone — Phosphorus Release and VFA Uptake
Polyphosphate-accumulating organisms (PAOs) in the anaerobic zone hydrolyze their stored polyphosphate and release orthophosphate into the bulk liquor, simultaneously assimilating volatile fatty acids and storing them as polyhydroxyalkanoates (PHA). The reaction is the precondition for everything downstream: no release here, no luxury uptake in the aerobic zone, no biological phosphorus removal. Typical design parameters for this zone are HRT 1–2 h and an F/M of 0.07–0.15 kg BOD/kg MLSS·d, applied to the zone alone.
The hard rule on this zone is exclusion. No dissolved oxygen, no nitrate — any O₂ or NO₃⁻ entering the anaerobic reactor destroys the competitive advantage PAOs hold over ordinary heterotrophs. That is why the RAS line must not carry residual DO; it is also why the mixed-liquor recycle is routed to the anoxic zone, not the anaerobic head. A nitrate slip of more than 5 mg/L into the anaerobic zone is the single most common cause of failed biological P removal in field audits (HydropureWater field data, 2025-11).
The visible signal that the biology is working is counterintuitive: TP at the anaerobic effluent typically runs 20–40 mg/L P, far higher than the influent. That "release" is the stored polyphosphate leaving the cell; the same phosphorus is re-absorbed — and then removed on the WAS line — once the sludge passes through the aerobic zone. If you do not see the rise, the PAOs are not cycling.
The Anoxic Zone — Denitrification with Recycled Nitrate
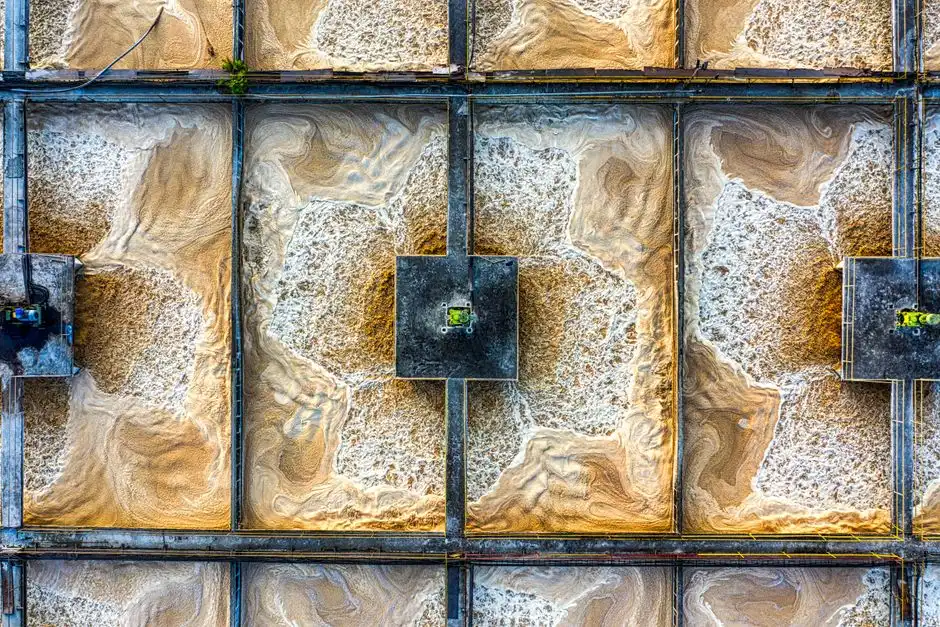
Heterotrophic denitrifiers in the anoxic zone reduce NO₃⁻ to N₂ gas using the remaining BOD as the electron donor. No air is supplied; mixing is mechanical only, with a power input around 5–8 W/m³ to keep solids in suspension without stripping DO into the water column. Typical sizing is HRT 1–3 h, MLSS 3,000–5,000 mg/L, with a target residual NO₃⁻ below 5 mg/L at the zone outlet — anything higher indicates either insufficient recycle or carbon limitation.
The mixed-liquor recycle ratio R is the most powerful tuning knob for total nitrogen. Pushing R from 200% to 400% of influent flow roughly halves the effluent NO₃⁻ until BOD becomes limiting, at which point additional recycle returns diminishing nitrogen removal against a rising pumping bill. The mass-balance rule of thumb: required R ≈ (target TN / influent NH₄-N) × 3.5, useful as a first-pass design check before running a calibrated BioWin or GPS-X model.
When the influent carbon is weak — BOD/TN below 4, which is common in industrial wastewater and in some consolidated sewer catchments — an external carbon source is dosed into the anoxic zone. Methanol at ~3 mg CH₃OH per mg NO₃⁻ removed, or acetate at ~2.5 mg COD per mg NO₃⁻ removed, restores the electron-donor balance. A PLC-controlled coagulant or methanol dosing skid is the typical hardware envelope, paced off the anoxic-zone NO₃ₓ probe.
The Aerobic Zone — Nitrification and Luxury Phosphorus Uptake
The aerobic reactor carries two microbial jobs in one tank. Autotrophic nitrifiers — Nitrosomonas oxidizing NH₄⁺ to NO₂⁻, then Nitrobacter oxidizing NO₂⁻ to NO₃⁻ — convert ammonia to nitrate. In the same basin, the PAOs that released phosphorus anaerobically now luxury-uptake it, storing polyphosphate well above their cell quota; that over-stored phosphorus leaves the system on the WAS line, completing biological P removal. Operating envelope: HRT 4–8 h, MLSS 3,000–5,000 mg/L, SRT 10–25 days, and a DO setpoint of 1.5–2.5 mg/L measured at the end of the tank farthest from the aeration grid.
DO control is the binding constraint. Below ~1.0 mg/L, nitrification collapses — Nitrobacter in particular has a half-saturation constant near 0.5 mg/L and stops oxidizing nitrite well before ammonia-oxidizers do, so a DO shortfall shows up as a rising NO₂⁻ peak before it shows up as rising NH₄⁺. Above ~2.5 mg/L, the surplus oxygen carries over into the anoxic and anaerobic zones via the recycle streams, collapsing denitrification efficiency and starving the PAOs. Modern plants use ammonia-based aeration control (NH₄⁺-based aeration) to walk that 1.5–2.5 mg/L band dynamically.
Expected steady-state performance with that envelope is ammonia removal above 95%, effluent NH₃-N under 5 mg/L, and effluent TP under 1 mg/L — provided the anaerobic and anoxic zones upstream are not leaking nitrate or DO. Whole-train SRT of 10–25 days is what retains the slow-growing nitrifiers; dropping below ~8 days typically washes them out, and recovery takes 2–3 SRTs.
AAO Design Parameters at a Glance

The table below consolidates the operating envelope for a conventional AAO train sized to municipal-strength influent (BOD 200 mg/L, TN 40 mg/L, TP 6 mg/L, 10–25 °C). Values tune to influent ratios, temperature, and the effluent permit — treat them as a starting point, not a finished design.
| Parameter | Anaerobic | Anoxic | Aerobic | Whole train |
|---|---|---|---|---|
| HRT (h) | 1–2 | 1–3 | 4–8 | 6–13 |
| MLSS (mg/L) | 3,000–5,000 | 3,000–5,000 | 3,000–5,000 | 3,000–5,000 |
| DO (mg/L) | < 0.2 | < 0.5 | 1.5–2.5 | — |
| F/M (kg BOD/kg MLSS·d) | 0.07–0.15 (zone basis) | — | — | 0.05–0.15 (whole train) |
| SRT (d) | — | — | — | 10–25 |
| Internal recycle / RAS | RAS 50–100% Q | Mixed-liquor recycle (R) 200–400% Q | — | — |
| Expected removal contribution | P release 20–40 mg/L TP out | TN drop to ≤ 15 mg/L | NH₃-N < 5 mg/L; TP < 1 mg/L | BOD > 95%; TN ≤ 15 mg/L; TP ≤ 1 mg/L |
Three sensitivities dominate the tuning. First, temperature: nitrification rate roughly halves for every 10 °C drop below 15 °C, so winter SRT must rise to compensate or ammonia will slip. Second, influent BOD/TN ratio: below 4, expect to dose external carbon or move to step-feed AAO. Third, peak wet-weather flow: the anaerobic zone is the most volume-sensitive and the first to fail under hydraulic shock, which is why primary equalization upstream is worth its footprint on a retrofit.
AAO vs A2O-MBR vs Step-Feed AAO — Choosing the Right 2026 Variant
Conventional AAO is the lowest-capex option: a footprint of 0.4–0.6 m² per m³/d of design flow, expected effluent of TN 10–15 mg/L and TP 0.5–1 mg/L, and a process envelope that any competent biological designer can commission. It is the right answer for greenfield municipal plants with stable influent and a BOD/TN ratio of 5 or better. A2O-MBR replaces the secondary clarifier with submerged PVDF membranes — the A2O-MBR integrated wastewater treatment system or a retrofit using DF-series PVDF MBR flat sheet modules — and tightens effluent to TN ≤ 10 mg/L and TP ≤ 0.5 mg/L while shrinking the biological-plus-solid-separation footprint by about 60%. It is the dominant 2026 retrofit choice where the existing clarifier is hydraulically constrained or where the permit is tightening below the conventional envelope.
Step-feed AAO splits the influent feed along the aerobic train rather than discharging it all at the anaerobic head, which reduces the internal recycle energy by 20–30% and uses the carbon more efficiently under low C/N conditions. It is the variant to choose for carbon-limited industrial influent or for municipal catchments where BOD/TN has drifted below 4 due to infiltration.
| Variant | Footprint (m²/m³/d) | Effluent TN (mg/L) | Effluent TP (mg/L) | Best-fit case |
|---|---|---|---|---|
| Conventional AAO | 0.4–0.6 | 10–15 | 0.5–1.0 | Greenfield municipal, BOD/TN ≥ 5, stable load |
| A2O-MBR | 0.15–0.25 | ≤ 10 | ≤ 0.5 | Retrofit with hydraulically constrained clarifier; tight TN/TP permit |
| Step-feed AAO | 0.4–0.6 | 8–12 | 0.5–1.0 | Carbon-limited industrial or low C/N municipal; recycle energy priority |
Decision rule for 2026: if the existing secondary clarifier cannot pass the design peak flow with a rise rate under 1.2 m/h, or if the permit is moving to TN ≤ 10 mg/L, retrofit to A2O-MBR. If the influent is industrial or BOD/TN is consistently below 4, evaluate step-feed before defaulting to methanol dosing. Otherwise, conventional AAO remains the most economic. A WSZ underground package plant built on a conventional AAO core remains a cost-effective option for small flows under 200 m³/d.
Integrating Pretreatment, Sludge Handling, and Disinfection Around the AAO Train
The AAO block is the biological heart, but it only performs when the surrounding unit operations are sized to its demands. Upstream, a rotary mechanical bar screen and grit chamber protect the anaerobic zone from rags and abrasives; the alternative — letting debris through — is the most common root cause of short-circuiting and dead pockets in the first reactor. Downstream of the clarifier or MBR, disinfection closes the pathogen gap; chlorine dioxide from a chlorine dioxide generator handles high-NH₄ effluents that would otherwise produce chloramines under chlorination, and UV handles the reuse-recycled-water case where residual oxidant is undesirable.
The sludge line carries about as much design weight as the water line. Waste activated sludge is thickened on a DAF unit or gravity thickener to 3–5% DS, then dewatered on a plate-and-frame filter press to 22–28% DS for off-site disposal or further digestion. For sites pursuing energy recovery, the dewatered cake feeds an anaerobic digester (see the anaerobic digester engineering guide for sizing and mixing rules), with the digester supernatant returned to the AAO head — a recycle that must be accounted for in the nitrogen and phosphorus mass balance or the permit will fail in summer. For tertiary polishing when biological P removal is short of a 0.5 mg/L TP limit, alum or PAC dosing into the aerobic zone effluent closes the gap; the PLC-controlled coagulant or methanol dosing skid is the same hardware used for carbon dosing, repurposed for polish. Plants chasing oxidative polishing for trace organics should review the AOP system energy efficiency benchmarks before specifying a UV/H₂O₂ or O₃ train, since the kWh/m³ figure is the dominant OPEX line.
Frequently Asked Questions
What is the typical internal mixed-liquor recycle ratio for an AAO plant?
200–400% of influent flow, with 300% as a common commissioning target. Increase it to push total nitrogen down, but only up to the point where the recycle pump energy and the marginal nitrate removed both make economic sense — typically until the BOD/NO₃ ratio in the anoxic zone drops below 4.
Why does the RAS line return to the anaerobic zone instead of the anoxic zone?
RAS carries the highest concentration of PAOs and must re-enter the anaerobic zone so they can repeat the release-and-uptake cycle; routing RAS to the anoxic head would feed nitrate-laden sludge into a zone that cannot denitrify it without sacrificing the anaerobic phosphorus release that the whole process depends on.
What effluent TN and TP can a well-tuned conventional AAO actually achieve?
TN ≤ 15 mg/L and TP ≤ 1 mg/L are realistic design targets at municipal temperatures above 15 °C with BOD/TN ≥ 5. Tightening to TN ≤ 10 mg/L or TP ≤ 0.5 mg/L typically requires an MBR retrofit, a step-feed modification, or chemical polishing.