
Why a Brewery Expansion Forces a New ETP Sizing Exercise
More beer means more wastewater with the same high-strength profile, and the existing effluent treatment plant is rarely sized for that step-change. Heineken's own disclosure at end-2020 puts the corporate baseline at 97% of wastewater volume treated before discharge, with 10 sites — representing 2.5% of beverage production — still operating without a treatment plant (Water Action Hub, S2). Any post-expansion design brief has to clear that bar from day one, not retrofit toward it.
Working from the standard mass balance, brewery wastewater generation runs at roughly 2.0 m³ of effluent per m³ of beer produced (S4, citing Drissen 2003 and Vereijken 2003). Take a site moving from 3 million hL/year to 5 million hL/year — a 67% volume jump. At the same 2.0 ratio, flow rises from 6,000 m³/d to 10,000 m³/d, and organic load climbs from the 25,000 kg COD/d that the Sedibeng plant already handles to approximately 41,000 kg COD/d (S3, Sedibeng case data).
Strength does not dilute with scale. Influent COD sits at 3,500–5,000 mg/L and BOD at 1,200–3,000 mg/L across both small and large breweries, because the polluting unit operations — mashing, boiling, fermentation, filtration, cleaning-in-place — produce the same residuals per hectoliter regardless of plant size (S4, Carlsberg India field data). Capacity therefore scales linearly with volume, but the absolute kilogram load the ETP must remove scales faster because the higher strength envelope persists. Sedibeng, treating 6,000 m³/d at 25,000 kg COD/d for a 3 million hL brewery, is the proof point: the existing asset can hit compliance today, but an expansion to 5 million hL forces a 60–65% uplift in both hydraulic and pollutant load.
What the Influent Looks Like After Expansion
Designing for "brewery wastewater" as a generic category is the fastest route to an undersized equalization tank. The engineer needs the actual parameter envelope, the variability behind it, and a buffer volume large enough to absorb it. The table below consolidates the Carlsberg India field data (S4) into the working influent set a post-expansion ETP must handle.
| Parameter | Typical Range | Design Implication |
|---|---|---|
| pH | 3.5–11 (CIP excursions), mean 6–8 | Buffer tank sized for pH swings; neutralization rarely needed if equalization is adequate |
| Total Suspended Solids (TSS) | 500–1,500 mg/L | Primary plate separator ahead of UASB; grit removal at headworks |
| Chemical Oxygen Demand (COD) | 3,500–5,000 mg/L | Anchors UASB volumetric loading at 4–6 kg COD/m³·d |
| Biochemical Oxygen Demand (BOD) | 1,200–3,000 mg/L | Drives aerobic polishing SRT and aeration demand |
| BOD/COD ratio | 0.3–0.6 | Lower ratio signals inhibitory compounds; need toxicity monitoring |
| Temperature | 25–45 °C | UASB performs in mesophilic range; CIP hot rinses push toward 45 °C |
Variability, not average strength, is the design driver. Brewing is batch by nature: mashing and boiling release carbohydrate-rich streams, fermentation drops ethanol and yeast, and CIP cycles send alkaline surfactant surges through the drain at 60–80 °C. Coefficient of variation for inlet COD at Carlsberg India ran from 3.7% to 27.9% across a 13-week study (S4, Table 2), confirming that a buffer tank is the first unit operation, not an optional extra.
For a 400 m³/d plant, Carlsberg India's buffer tank sits at 380 m³ — a 23-hour retention that has proved sufficient to dampen pH, flow, and organic-load spikes before the UASB (S4, Table 1). Scaling that 23-hour envelope linearly to a 10,000 m³/d expansion case gives roughly 9,600 m³ of equalization volume, distributed across at least two tanks for maintenance redundancy. The CIP-alkalinity and temperature transients are the operational risks that actually set the residence time: skim and cool before the buffer, or size for the worst-case thermal load.
The Core ETP Train: UASB Plus Aerobic Polishing
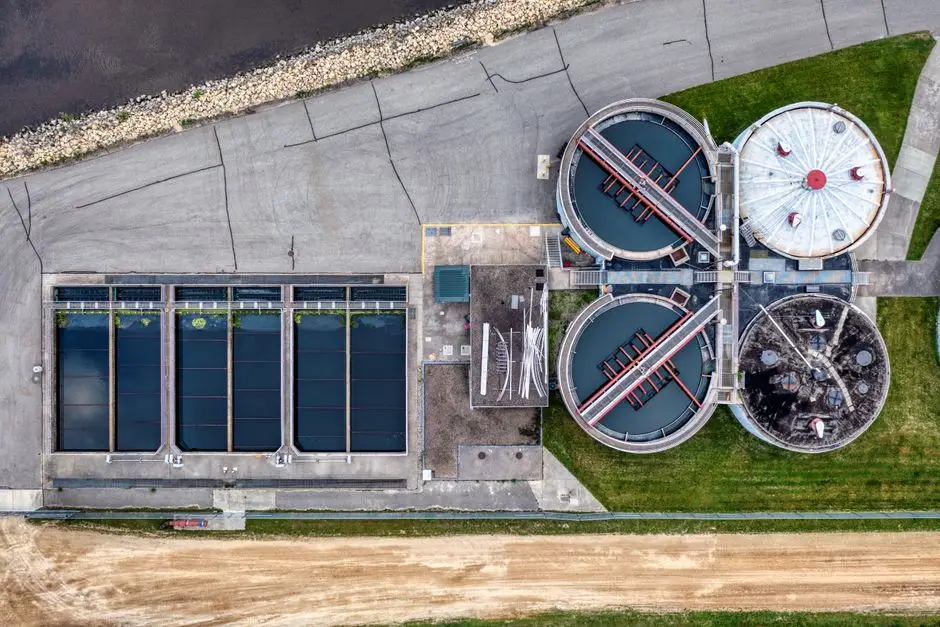
The reference train Heineken-aligned plants are built around is a UASB anchor followed by aerobic polishing and sludge handling — not because it is novel, but because it has been proved at the scale an expansion demands. At Sedibeng, the train runs: influent screening → balancing tank → three parallel UASB reactors → continuous aeration with clarifier → sludge dewatering → sand filtration (S3). At Carlsberg India's 400 m³/d facility, the equivalent train is: buffer tank → UASBR → primary plate separator → aeration tank → SAFF reactor → secondary plate separator → sand filter → activated carbon filter (S4). The order is the same; the unit-ops are interchangeable where local conditions favor one over another.
UASB performance is consistent across both references. At Carlsberg India, volumetric loadings of 4.77–6.93 kg COD/m³·d against a recommended 2–6 kg COD/m³·d delivered 92–95% COD removal, 90–94% BOD removal, and 77–84% TSS removal (S4). Operating at the upper end of the loading envelope — as the Sedibeng-scale plant will — requires granular-sludge monitoring to keep the reactor from washing out, particularly after CIP surges.
The energy story is what makes UASB the anchor rather than a downstream option. Replacing the original activated-sludge process at Carlsberg India with UASBR cut aeration energy by approximately 50% (S4). At Sedibeng, the captured biogas fuels cogeneration units that produce heat and power on site (S3), turning the wastewater asset into a net energy contributor. Final effluent across the full train — UASB plus aerobic plus tertiary filtration — meets the discharge envelope of pH 5.5–9.0, BOD ≤ 30 mg/L, and TSS ≤ 100 mg/L (S4, Table 3) with overall removal efficiencies of 96–98% COD, 99% BOD, and 88–98% TSS, and a final pH of 7.09–7.28 (S4).
| Unit Operation | Sedibeng (3 million hL, S3) | Carlsberg India (400 m³/d, S4) |
|---|---|---|
| Headworks | Influent screening | Collection tank, grit removal |
| Equalization | Balancing tank | Buffer tank, 380 m³, 23 h retention |
| Anaerobic | 3 parallel UASB reactors | UASBR, 270 m³, 17 h retention |
| Primary separation | Integrated in reactor | Primary plate separator, 20 m³ |
| Aerobic | Continuous aeration + clarifier | Aeration tank 380 m³ + SAFF reactor |
| Secondary separation | Clarifier | Secondary plate separator, 20 m³ |
| Tertiary | Sand filtration | Pressure sand filter + activated carbon filter |
| Sludge handling | Sludge dewatering | Sludge drying beds, 15-day retention |
For the headworks end of an expansion build, a rotary mechanical bar screen for brewery headworks protects the buffer tank and downstream reactors from packaging-line debris and spent-grain carryover. The screened solids drop straight to the plate and frame filter press for brewery UASB sludge train for dewatering to roughly 22–25% dry solids, the threshold at which the cake becomes stackable and haulable.
Adding Water Reuse to the Expansion ETP
Once the ETP is designed for compliance, the second question for a Heineken-aligned site is whether to add a reuse loop on the same hydraulic line. Sedibeng did, and the numbers are now part of the reference set: the recovery train sits after sand filtration and runs filtration → UF → RO → chlorination (S3). It reclaims 1,516 m³/d and cuts municipal water intake by 30%, the volumetric equivalent of 18 Olympic swimming pools of process water every month (S3).
The mass split is what an engineer needs to see clearly. Sedibeng treats 6,000 m³/d; 4,500 m³/d of the treated effluent is discharged to the receiving river in compliance with local regulations, and the balance — 1,516 m³/d as of the case data, which scales with the operating envelope — is sent through the reuse plant (S3). Reuse is a sidestream of the main ETP, not a replacement for the compliance discharge. Designing the biological train at 10,000 m³/d for a 5 million hL expansion means the reuse train can reasonably be sized to reclaim 2,500–3,000 m³/d, holding the same 25–30% recovery ratio that defines the 2026 Heineken baseline.
Biogas from the UASB feeds cogeneration for heat and power (S3), and the trend lines for brewery-side biogas recovery from brewery UASB reactors point to a tightening OPEX case as grid tariffs rise through 2026. The water-reuse and energy-recovery loops are not separate projects — they share the same UASB anchor, the same operator skill set, and the same mass balance. The two product references that close this loop in an expansion design are an industrial RO system for brewery water reuse for the polishing stage, and an MBR bioreactor system for brewery reuse-grade effluent as an alternative polishing backbone where footprint or reuse quality is the binding constraint.
Choosing the Right Upgrade Backbone: UASB, SBR, or MBR
The biological backbone chosen for the post-expansion ETP depends less on technology fashion than on site constraints: available footprint, grid-power cost, target reuse quality, and how badly the existing influent swings between batches. The table below puts the three realistic options on the same axes.
| Criterion | UASB + Aerobic Polishing | SBR | MBR |
|---|---|---|---|
| Relative footprint | Large (reactor + clarifier) | Medium (single tank, time-shared) | Small (membrane cassettes replace clarifier) |
| Energy intensity | Lowest (biogas credit, ~50% lower aeration than ASP, S4) | Moderate (batch aeration; air-recirculation tuning helps) | Higher (membrane aeration + permeate suction) |
| Reuse readiness | Requires downstream UF/RO for reuse | Requires tertiary filtration for reuse | Reuse-ready permeate; often paired with RO |
| COD removal (full train) | 96–98% (S4) | 90–95% typical | 95–99% |
| Sensitivity to load swings | Medium — needs buffer tank and granular-sludge monitoring | High — time-cycle flexibility is the asset | Low — membranes buffer effluent quality |
| Biogas yield | High — direct from UASB | None in main reactor | None unless sidestream anaerobic |
UASB wins on energy and biogas but needs stable mesophilic temperature and grit control at the headworks; it is the Heineken Sedibeng and Carlsberg India reference and remains the lowest-OPEX backbone for a greenfield with reasonably cheap grid power. SBR offers flexibility for batch effluent at the cost of larger tanks, and the OPEX penalty can be partially offset through SBR energy optimization for brewery wastewater using air-recirculation and DO setpoint control — a real lever, but not enough to make SBR the default for a 10,000 m³/d expansion. MBR delivers reuse-ready effluent in roughly 60% of the footprint of a conventional activated-sludge train, which is the binding argument on a constrained urban site; pairing MBR with RO is the shortest path to reuse-grade water in a water-scarce basin. An MBR bioreactor system for brewery reuse-grade effluent is the natural backbone where reuse drives the business case more than biogas does. For a fuller cost and compliance read on the southern-European build conditions many global brewers face, the regional benchmark at industrial wastewater treatment costs and compliance in 2026 provides a useful counterpoint to the South African and Indian references.
Sizing the Expansion ETP: A Worked Example
Anchor the expansion case to a 5 million hL/year brewery. Using the 2.0 m³ wastewater per m³ beer ratio (S4), annual effluent is 10 million m³, or roughly 10,000 m³/d at 330 operating days. Applying the Sedibeng COD-to-flow ratio of 4.17 kg COD per m³ of treated wastewater (25,000 kg COD/d at 6,000 m³/d, S3) gives an organic load of approximately 41,000–42,000 kg COD/d for the post-expansion design point.
UASB reactor volume follows the volumetric loading envelope of 4–6 kg COD/m³·d recommended for high TSS and COD removal (S4). At 4 kg COD/m³·d, the reactor volume is 10,300 m³; at 6, it is 6,850 m³. Distribute across 3–4 parallel reactors in the Sedibeng configuration to keep each unit within a manageable footprint and to maintain treatment continuity during desludging. Buffer-tank volume scales the Carlsberg India 23-hour retention linearly: 10,000 m³/d × 23/24 h ≈ 9,600 m³. Aerobic polishing scales the Carlsberg India aeration-tank ratio of 380 m³ per 400 m³/d (S4) to roughly 9,500 m³ for the expansion case.
The tertiary/reuse train follows the same logic. Reclaiming 25–30% of the treated flow — the Heineken 2026 baseline — gives 2,500–3,000 m³/d of RO feed after UF pretreatment. Sludge dewatering for the combined UASB and aerobic waste stream is sized to a plate and frame filter press for brewery UASB sludge train producing 22–25% dry-solids cake. The mass balance is the same one Sedibeng runs, scaled by 1.65×: same unit operations, same removal efficiencies, larger vessels. An engineer can lift the volume line-items directly into a datasheet and run the case against local discharge tariffs.
Frequently Asked Questions
What is the standard treatment train for a Heineken-style brewery ETP?
The reference train is screening → equalization → UASB → aerobic polishing → sand filtration, with optional UF/RO reuse and biogas cogeneration from the UASB. Sedibeng runs three parallel UASB reactors and reclaims 1,516 m³/d from 6,000 m³/d of treated wastewater (S3).
What discharge limits must a brewery ETP meet?
The Indian fermentation-industry standard cited in S4 sets pH 5.5–9.0, BOD ≤ 30 mg/L for inland surface-water discharge (≤ 100 mg/L for irrigation), and TSS ≤ 100 mg/L. A well-operated UASB + aerobic + tertiary train delivers 96–98% COD, 99% BOD, and 88–98% TSS removal (S4).
How much of Heineken's wastewater is currently treated before discharge?
Heineken reported that 97% of its wastewater volume was treated before discharge at end of 2020, with 10 sites — 2.5% of beverage production — still lacking a treatment plant (S2, Water Action Hub disclosure). The Sedibeng plant in South Africa reclaims 1,516 m³/d and cuts municipal water intake by 30% (S3).
How much wastewater does a brewery generate per hectoliter of beer?
The mass-balance benchmark is approximately 2.0 m³ of wastewater per m³ of beer produced (S4, citing Drissen 2003 and Vereijken 2003). A 5 million hL/year brewery therefore generates on the order of 10,000 m³/d of effluent, against 6,000 m³/d for a 3 million hL site such as Sedibeng (S3).