
Why rack wash water is a different MBBR sizing problem
Rack wash water — the effluent from cleaning bottle racks, crates, totes, and process piping with hot alkaline detergent, surfactant, and sanitizer — is not "dilute laundry." It runs batchy, at 30–60 °C, with pH swinging from 2 (sanitizer rinse) to 12 (caustic CIP) inside a single shift, and it carries COD of 800–5,000 mg/L, linear alkylbenzene sulfonate (LAS) surfactant, NaOH/KOH residual, and phosphates from the detergent builders (Kusuma et al., DOI 10.26418/jtllb.v7i1.31882). Generic MBBR sizing articles assume a steady municipal feed; the rack wash stream breaks that assumption on three points — foam strips biofilm on a conventional aeration tank, the COD peak-to-average ratio routinely exceeds 2.5×, and the BOD:N:P ratio is often phosphate-rich and nitrogen-deficient. A defensible MBBR design starts with equalization to flatten the pH and surfactant slug, then sizes the reactor for the upper end of the published HRT window. The Tanjungpura laundry MBBR study (Kusuma et al., 2018) confirmed that a surfactant-bearing stream at 20% Kaldnes K1 fill is treatable, which gives the designer a published benchmark rather than a vendor number to defend in review.
Step 1 — Characterize the rack wash flow and load
Characterization is the step most teams under-invest in. Pull composite samples across at least three CIP/wash cycles and report the minimum, mean, and peak for each parameter, not a single grab. The number that drives reactor sizing is daily pollutant load in kg/d, computed as Q (m³/d) × C (mg/L) ÷ 1000. A representative 50 m³/d rack wash stream at a mean 2,000 mg/L COD therefore loads 100 kg COD/d onto the biology; at peak (3,500 mg/L) the same flow spikes to 175 kg COD/d. The peak shift factor for rack wash typically runs 1.5–2.5× the daily average, and the equalization basin must be sized against that peak, not against the mean.
BOD:N:P is the second number to lock down. Surfactant streams run phosphate-rich (from detergent builders) and nitrogen-deficient; if BOD:N exceeds 100:5, plan for urea or ammonia dosing ahead of the MBBR or nitrification will collapse. LAS surfactant itself is the third number — sample it explicitly, since COD alone will not tell you whether the foam control system is sized for the actual slug.
| Parameter | Unit | Min | Mean | Peak | Design basis |
|---|---|---|---|---|---|
| Flow Q | m³/d | 30 | 50 | 125 (2.5×) | Equalize to mean |
| COD | mg/L | 800 | 2,000 | 5,000 | 100 kg/d at mean |
| BOD₅ | mg/L | 400 | 1,100 | 2,500 | BOD:COD ≈ 0.55 |
| LAS surfactant | mg/L | 20 | 80 | 250 | Drives foam control |
| Total P (as PO₄) | mg/L | 10 | 30 | 60 | P-rich, N-deficient |
| pH | — | 2 | 9 | 12 | Trim to 6.5–8.5 |
| Temperature | °C | 25 | 40 | 60 | Cool to 20–35 °C |
Step 2 — Pick the design HRT and check it against published MBBR data
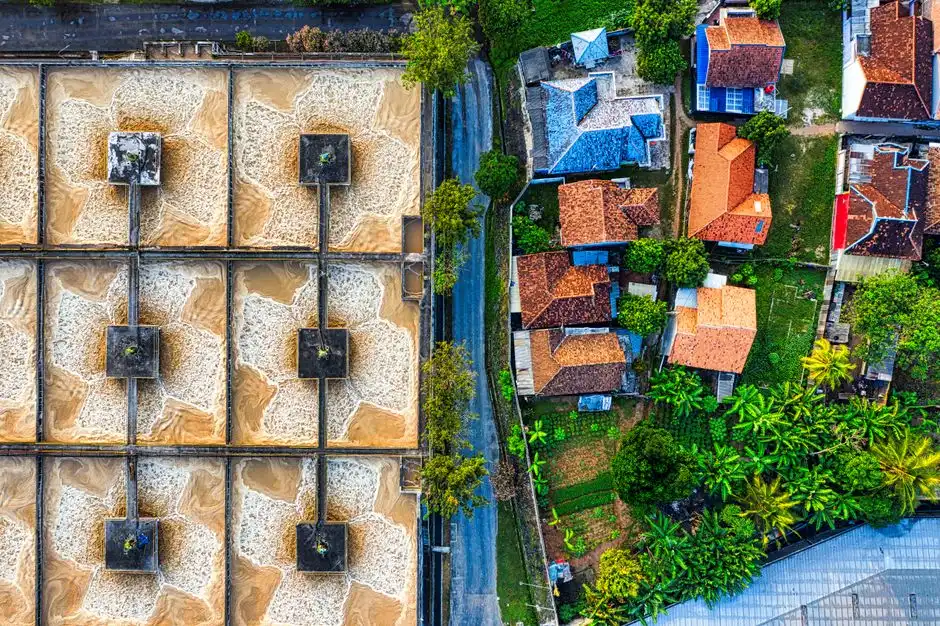
Published MBBR data for organic/surfactant streams clusters between 5 and 15 hours of hydraulic retention time. The Smitha G. review (IJSR, 2017, DOI 10.21275/art20179091) reports MBBR operation at 5, 10, and 15 hours on 120–150 mg/L COD in Spain, and a hybrid MBBR configuration at 12 hours — bracketing the realistic design window. For a rack wash stream at COD ≥ 1,500 mg/L the design must sit at the upper end of that window: 10–15 hours gives the biofilm the residence time it needs to oxidize LAS and residual alkaline cleaner, and it absorbs the diurnal swings without washout. The MBBR sizing window for the related factory white water stream is covered in our MBBR sizing guide for general factory white water, but rack wash sits at the stronger end of that envelope. Cross-check the HRT choice against the food-to-microorganism ratio (F/M) — target 0.2–0.5 kg BOD/kg MLVSS·d for an established attached-growth biofilm.
The surfactant-specific check matters as well: the Kusuma et al. laundry MBBR study reported LAS removal above 80% at 20% K1 fill, but only when HRT stayed at or above 8 hours at 20–25 °C. Drop below 8 hours on a surfactant stream and the effluent foam potential stays high regardless of media fill.
Step 3 — Size the reactor volume and the media fill
Working volume is the core numeric deliverable. V_reactor (m³) = Q (m³/h) × HRT (h). For a mean flow of 5 m³/h and a 12-hour HRT, V = 60 m³ of submerged media zone — the number that drives tank fabrication. Media volume is then V_reactor × fill fraction. The 20% Kaldnes K1 benchmark is published for surfactant-bearing wastewater (Kusuma et al.), and it remains the conservative default. When footprint is constrained, the same 60 m³ tank can be pushed to 30–40% fill, but only if the aeration system is sized to keep the higher carrier loading fully fluidized.
Carrier selection is a separate decision from fill fraction. K1 HDPE carriers sit at roughly 500 m²/m³ of protected surface area and are the published benchmark; K3 carriers increase the protected area to roughly 800 m²/m³ and allow a smaller reactor for the same attached biomass. Sponge media push the specific surface area into the 2,000–4,000 m²/m³ range but demand a different mixing regime and are not interchangeable with K1 on a vendor's standard curve — keep the 20% K1 fill benchmark as the anchor for the spec. Add 20–25% freeboard for aeration, foam control, and media migration, and round the final tank to a standard dimension: a 4 m × 4 m × 5 m SWD tank holds the 60 m³ working volume with the required headroom.
| Design input | Symbol | Value | Source / note |
|---|---|---|---|
| Mean flow | Q | 5 m³/h (120 m³/d) | Equalized stream |
| Design HRT | θ | 12 h | Upper end of IJSR 5–15 h window |
| Reactor working volume | V | 60 m³ | V = Q × θ |
| Media fill fraction | f | 20% (default), 30–40% (footprint-constrained) | Kusuma et al. 20% benchmark |
| Media volume | V_m | 12 m³ at 20% | V_m = V × f |
| Freeboard allowance | — | 20–25% | Foam + migration |
| Tank dimension (example) | L × W × SWD | 4 m × 4 m × 5 m | 64 m³ gross, 60 m³ working |
Step 4 — Aeration, mixing, and pretreatment that protect the biofilm
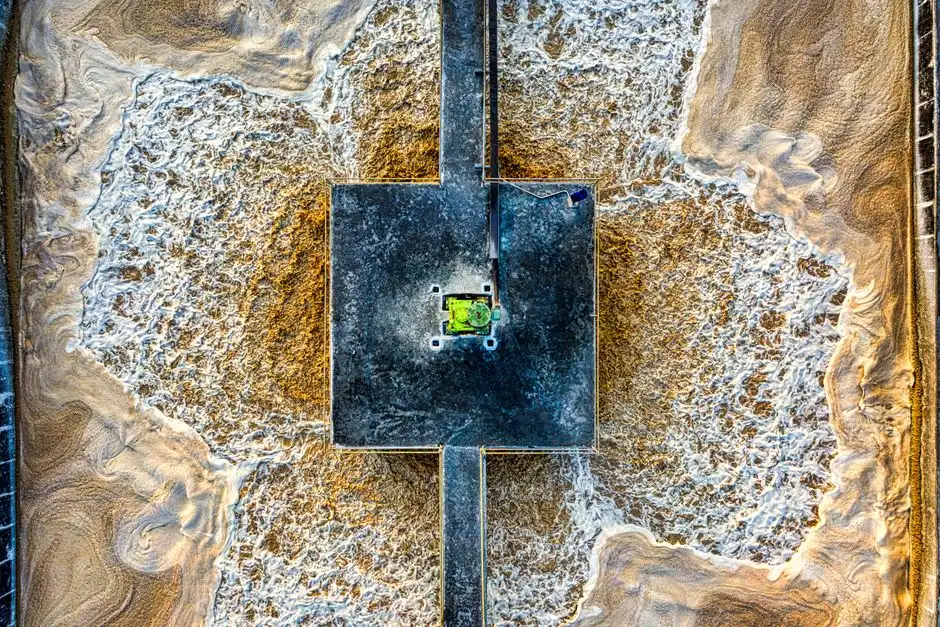
The most common MBBR failure on surfactant streams is not under-sized biology — it is biofilm loss to foaming or pH shock. The supporting systems the vendor quote often omits are the ones that determine whether the design holds. Aeration must fluidize the carriers, not just dissolve oxygen: coarse-bubble density in the 0.2–0.3 m³ air per m² of tank area per minute range, designed at the higher end when surfactant foam is present. Dissolved oxygen setpoint stays at 2–3 mg/L, and the air demand works out to roughly 1.5–2.0 kg O₂ per kg BOD removed plus endogenous and nitrification demand — for the 100 kg COD/d example above, that is 55–75 kg BOD/d removed at design load.
Pretreatment is the second line of defense. Install a rotary bar screen for headworks protection at 2–3 mm aperture to keep plastic strapping and broken crate fragments out of the carrier bed, and an equalization basin sized for 8–24 hours of hold to flatten the pH 2 → 12 swings. Trim pH to 6.5–8.5 before the MBBR using an automatic chemical dosing for pH trim and nutrient balancing, and add a defoaming spray header with 200–300 mm of freeboard above the media line — surfactant carryover will otherwise lift biomass out of the reactor and into downstream equipment.
Design parameter summary and acceptance criteria
The table below is the one-page datasheet a designer can drop into a purchase spec or a permit application. Performance numbers are anchored to the MBBR studies cited above: COD removal 80–95%, BOD removal 90–95%, and LAS surfactant removal above 80% on laundry-type streams at 20% K1 fill (Kusuma et al., 2018).
| Parameter | Design value | Acceptance / expected effluent |
|---|---|---|
| Design flow | 5 m³/h (120 m³/d mean) | — |
| Peak flow (post-equalization) | 6.5 m³/h | — |
| HRT | 12 h | 8–15 h acceptable band |
| Media fill | 20% Kaldnes K1 | 30–40% with verified aeration |
| Aeration rate | 0.25–0.30 m³ air/m²·min | Keep carriers fluidized |
| DO setpoint | 2–3 mg/L | — |
| Effluent COD | — | < 250 mg/L (85–90% removal) |
| Effluent BOD₅ | — | < 30 mg/L (90–95% removal) |
| Effluent LAS | — | < 15 mg/L (> 80% removal) |
| pH at MBBR inlet | 6.5–8.5 | After pH trim |
| Sampling plan | 24 h composite, 2×/week for 60 d, then monthly | For discharge permit |
Downstream, send the MBBR effluent to a lamella clarifier for MBBR effluent polishing to capture sloughed biofilm, and dewater the wasted sludge on a plate-and-frame filter press for waste activated sludge before off-site disposal. Pair this train with a DAF unit sized for the rack wash stream if the surfactant carryover is heavy enough to upset the clarifier.
Frequently Asked Questions
What HRT should I use for an MBBR on rack wash water?
8–12 hours is the engineering default for rack wash strength, sitting at the upper end of the 5–15 h window reported in the IJSR MBBR review (Smitha G., 2017, DOI 1
Frequently Asked Questions
What HRT should I use for an MBBR treating rack wash water?
For rack wash water, which typically contains high concentrations of surfactants and organic loads, a Hydraulic Retention Time (HRT) of 4 to 8 hours is standard. This range ensures sufficient contact time for the biofilm to degrade complex detergents and emulsified fats before effluent discharge.
How much Kaldnes K1 media do I need per cubic meter of MBBR?
The standard fill fraction for Kaldnes K1 media typically ranges from 40% to 60% of the reactor's total volume. Given that K1 media has a specific surface area of approximately 500 square meters per cubic meter, this fill rate provides the necessary biofilm surface area to handle typical rack wash COD loading rates of 1.5 to 3.0 kg COD/m³/day.
Can an MBBR handle alkaline CIP spikes from rack washing?
MBBR systems can handle alkaline CIP (Clean-in-Place) spikes provided an equalization tank is utilized to buffer pH levels between 6.5 and 8.5. While the robust biofilm in an MBBR is more resilient than suspended growth systems, sudden pH excursions above 10.0 will inhibit nitrifying bacteria and require automated chemical dosing for neutralization prior to the biological stage.
What is the difference between MBBR and MBR for wash water?
The primary difference lies in the solid-liquid separation mechanism; MBBR uses a fixed-film process where biomass grows on plastic carriers and requires a secondary clarifier or DAF unit for effluent polishing. In contrast, MBR (Membrane Bioreactor) utilizes submerged micro- or ultra-filtration membranes to replace the clarifier, producing a higher quality permeate suitable for reuse but requiring significantly higher energy for membrane scouring and frequent chemical cleaning.
How do I calculate the working volume of an MBBR?
The working volume is calculated by dividing the design organic loading rate (kg COD/day) by the target volumetric removal rate (kg COD/m³/day) adjusted for the specific media surface area. Engineers must also account for a 10% to 15% freeboard allowance to prevent media carryover, ensuring the calculated liquid volume occupies the space between the inlet baffle and the effluent retention screen.