What Drives the Cost of Industrial Wastewater Treatment in Oman
Five variables set the 2026 budget for any Omani industrial wastewater plant: influent characteristics (BOD, COD, TDS, oil & grease), discharge standard under Royal Decree 18/93 and Ministerial Decision 159/2005, daily capacity, the reuse percentage required by Oman Vision 2040, and the contract model (EPC purchase versus DBO versus BOOT). Miss any one of them and the line item is wrong by 30–60%.
Salinity is the single largest Omani-specific uplift. Typical Sohar Port and Salalah free-zone influent runs 1,500–35,000 mg/L TDS, against an EU/China norm of <2,000 mg/L (HydropureWater field data, 2026). Pushing that brine through an MBR plus RO train instead of a conventional activated-sludge plant adds USD 350–600K of CAPEX for a 2,000 m³/day skid and roughly USD 0.06–0.09/m³ of energy, the numbers that separate an Omani budget from a Gulf-of-Mexico benchmark.
The supply market is competitive. The Omani government has allocated OMR 212.7M to 112-plus wastewater projects in the 2025–2027 cycle (per the 2026 Oman Water Treatment as a Service market report), which means EPC estimators should expect 8–12% margin compression versus the 2022–2023 quote cycle. On top of that, Sohar and Salalah free-zone operators (Majis, Octal, Salalah Methanol) typically require marine outfall or near-ZLD compliance, raising CAPEX 20–35% versus an inland discharge with the same flow. The full high salinity treatment cost breakdown and the BOD and TSS discharge limit comparison by country sit behind those numbers for readers who need the underlying limits.
CAPEX and OPEX Benchmarks by Plant Size and Industry
For a defensible 2026 number, the cleanest reference is the Toshiba Sohar CETRP1 10,000 m³/day DBO project delivered to Majis in 2016 — a biological plant plus RO producing 7,500 m³/day of recycled water at <25 ppm TDS. That project sets the upper bound near USD 8–9M CAPEX equivalent at 2016 prices; the same scope today, with ESD expansion and Vision 2040 reuse compliance, lands closer to USD 10–12M.
The matrix below uses 2026 landed cost in Oman, mid-scope (biological + clarification, no full ZLD), and assumes compliance with MD 159/2005 inland discharge. Add 20–35% for marine outfall or near-ZLD.
| Capacity (m³/day) | Sector | 2026 CAPEX (USD M) | 2026 OPEX (USD/m³) | Dominant process |
|---|---|---|---|---|
| 500 | Food & beverage, textile | 0.8–1.2 | 0.25–0.40 | Packaged MBR membrane bioreactor for 10–2,000 m³/day industrial plants |
| 2,000 | Food & beverage, textile | 2.2–3.5 | 0.20–0.32 | MBR + DAF pre-treatment (DAF system for food, oil, and textile pre-treatment) |
| 2,000 | Refinery / petrochemical | 3.5–5.2 | 0.32–0.48 | CPI/DAF + MBR + RO brine line |
| 10,000 | Refinery / petrochemical (Sohar-class) | 8.0–12.0 | 0.28–0.42 | MBR + RO reuse train, marine outfall |
| 10,000 | Steel / power | 9.0–14.0 | 0.35–0.55 | High-TDS RO + brine management, ZLD for inland |
OPEX composition is stable across these tiers: energy 45–55%, sludge handling 15–20%, chemicals 8–12%, labor 10–15% (HydropureWater field data, 2026). Energy dominates because MBR aeration and RO high-pressure pumps run continuously, which is why a 2,000 m³/day plant in Sohar draws 180–260 kW continuously. For GCC context, the same scope lands roughly 5% higher in the UAE, 8% lower in Saudi Arabia, and 35% lower in Egypt — useful when a vendor's quote looks like an outlier.
Every 10,000 m³/day cell in that matrix assumes an industrial RO system for Vision 2040 reuse compliance on at least 50% of the flow, because planning a plant today without RO means a forced retrofit before 2030.
Process Selection: How Technology Choice Moves the Cost Number
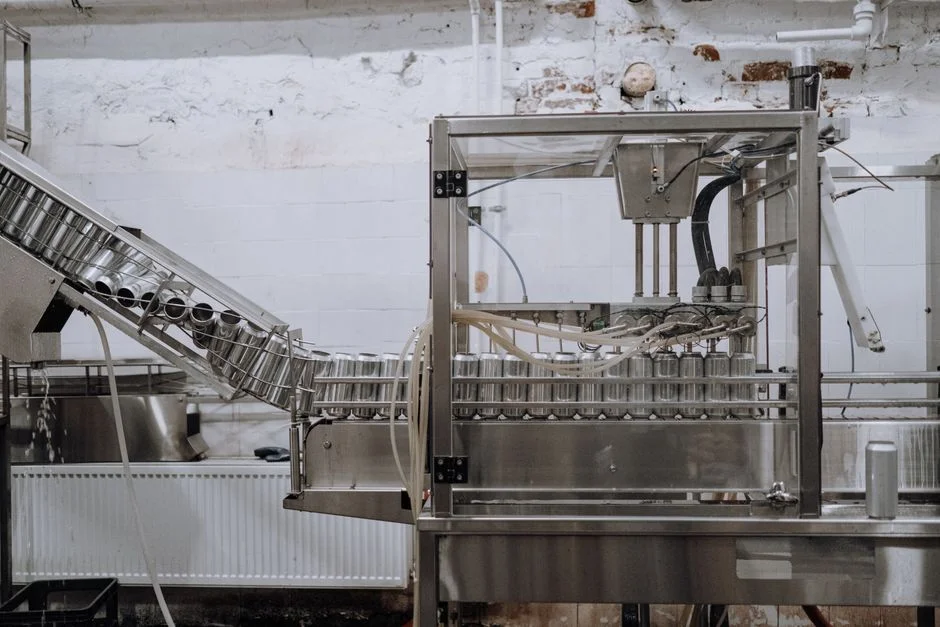
Process selection is where the budget gets either defended or destroyed. The cause-and-effect chain runs influent → primary → secondary → tertiary → sludge, and each link has a price.
| Stage | Technology | Indicative CAPEX (USD) | Operating note |
|---|---|---|---|
| Primary — food / oil-rich | DAF | 80K–180K per train | Removes 60–90% oil & grease, protects downstream MBR |
| Primary — textile | Screening + equalization, rotary bar screen | 40K–90K | Buffers pH 9–11 and BOD shocks from dye baths |
| Primary — refinery desalter brine | CPI or DAF + oil skimmer | 120K–260K | Free oil <50 mg/L before biological stage |
| Secondary | MBR vs SBR vs CAS | MBR 2–2.5× CAS capex | MBR delivers <30 mg/L TSS, <50 mg/L COD at 60% smaller footprint, ~15% higher membrane-replacement OPEX |
| Tertiary / reuse | Industrial RO | 350K–600K for 2,000 m³/day | Energy 0.06–0.09 USD/m³; <25 ppm TDS at Sohar spec |
| Sludge | Plate-and-frame filter press | 180K–420K | 22–28% DS — preferred for Be'ah licensed-carrier compliance |
| Solids clarification | High-efficiency sedimentation tank | 90K–210K | Cuts clarifier footprint 40% vs conventional |
Zero liquid discharge (thermal brine concentrator plus crystallizer) only enters the budget when the site is inland with no marine outfall, or when the influent carries rare-earth or steel-mill heavy metals. For a 1,000 m³/day brine stream, ZLD CAPEX is USD 4–8M, with thermal energy at 18–28 kWh/m³. The economic case improves sharply once Oman Vision 2040 reuse targets are priced in: the 35% reuse threshold by 2030 effectively mandates RO on most new plants, and the 100% target by 2040 forces a ZLD retrofit on any inland plant that cannot find a reuse offtaker. Choosing to skip those stages today to save CAPEX is a 5–8-year forced retrofit, not a saving.
Contract Model Comparison: EPC Purchase vs DBO vs BOOT in Oman
For an SME in Rusayl or Buraimi, EPC purchase — buying a skid, warranting it for 12–24 months, and running it in-house — remains the default. For a free-zone operator above 5,000 m³/day with a reuse obligation, DBO and BOOT now win on total cost of ownership.
| Model | CAPEX exposure | Risk transfer | Typical Omani $/m³ | Best fit |
|---|---|---|---|---|
| EPC purchase | 100% to client | Performance warranty 12–24 months only | OPEX 0.20–0.55 | <2,000 m³/day, no reuse obligation |
| DBO (10–20 yr) | 0% to client (vendor finances build) | Process performance, compliance, availability | 0.45–0.65 | 2,000–10,000 m³/day, reuse target, marine outfall |
| BOOT (15–20 yr) | 0% to client, vendor owns asset during contract | Full lifecycle, then transfer | 0.55–0.85 | Municipal-cluster-scale, government counterparty |
Quantify the DBO premium at 15–25% over an equivalent EPC CAPEX (HydropureWater field data, 2026), partially offset by 10–15% lower lifetime OPEX because the vendor optimizes chemical dosing, aeration, and membrane-replacement cycles across a fleet. The Sohar CETRP1 reference charges clients per m³ treated, which is exactly that model. The first Omani water cluster contract, valued at approximately USD 2.34B over 15 years, signals that BOOT/DBO is now the default for large industrial water projects. For chemical-handling, an automatic chemical dosing system and a chlorine dioxide generator are the typical tertiary-stage items specified inside any of these contracts, regardless of model.
Oman Regulatory and Market Context That Shapes 2026 Pricing
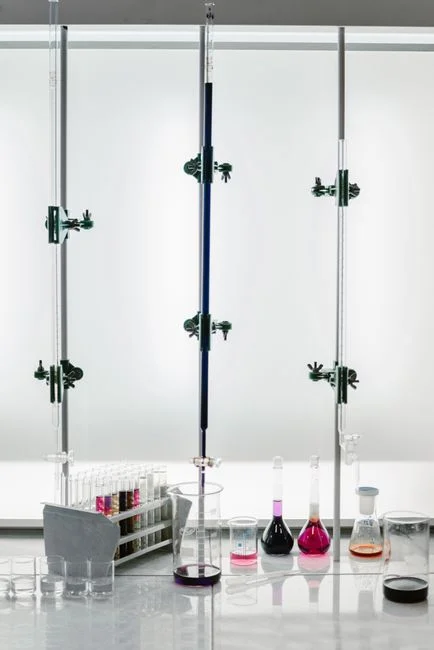
Royal Decree 18/93 and Ministerial Decision 159/2005 remain the primary discharge and marine-outfall framework, with non-compliance penalties now enforced in the OMR 5,000–50,000 per-incident range. A single exceedance event in the Sohar free zone will erase the entire OPEX saving from a cheap EPC purchase, which is why risk-transfer pricing is justified.
Oman Vision 2040 sets a 35% treated-wastewater reuse target by 2030 and 100% by 2040, both of which directly shape 2026 CAPEX. A plant designed today without RO will be non-compliant inside ten years. The Omani Water Treatment as a Service market is projected to grow from USD 242M (2025) to USD 460M (2031) at 11.30% CAGR, against 8.90% for 2020–2025, which is the macro evidence that 2026 is a competitive tender year. Be'ah now mandates licensed sludge carriers for any industrial site generating above 5 m³/month of sludge, which pushes most Omani operators toward plate-and-frame presses (22–28% DS) and away from belt presses (18–20% DS). The CAPEX OPEX ROI calculator for high-salinity projects translates that requirement into a per-m³ disposal number. The MBR supplier comparison for Oman extends the regulatory floor into equipment selection.
Frequently Asked Questions
What is the all-in cost of a 1,000 m³/day industrial wastewater plant in Oman in 2026? A packaged MBR with DAF pre-treatment and no RO lands at USD 1.4–2.0M CAPEX and USD 0.22–0.32/m³ OPEX. Adding RO for Vision 2040 reuse adds roughly USD 250K and 0.06–0.09 USD/m³ in energy.
How much more does a DBO contract cost versus buying the equipment outright? DBO adds a 15–25% CAPEX premium but shifts process, compliance, and availability risk to the vendor for 10–20 years, and lifetime OPEX runs 10–15% lower. At Sohar scale, that nets positive for any project above 5,000 m³/day.
Which Omani industries pay the most for wastewater treatment? Refinery and petrochemical operators top the matrix at USD 0.32–0.48/m³ OPEX, driven by desalter brine, high TDS, and marine-outfall requirements. Food and textile sit at the lower bound, typically USD 0.20–0.32/m³ OPEX for a 2,000 m³/day MBR.
Is reverse osmosis mandatory for Omani industrial plants? Not yet, but the 35% reuse target by 2030 makes RO economically mandatory for any plant that cannot find a discharge alternative, and the Sohar recycled-water spec of <25 ppm TDS cannot be met without it. Inland plants should also plan a ZLD retrofit path.
How long does a 5,000 m³/day industrial wastewater plant take to build in Oman? A conventional EPC schedule runs 12–18 months from notice to proceed, including commissioning. If ZLD is in scope, add 6–10 months for thermal-equipment delivery and pilot, pushing the total to 24+ months.