Why Refinery Effluent Phosphorus Is a 2026 Compliance Hotspot
China's GB 31573-2024 tightened the petroleum refining discharge limit for total phosphorus to 0.5 mg/L (down from 1.0 mg/L), and 2026 is the first full year refineries must demonstrate compliance against that floor. US EPA 40 CFR 435 Subpart A already sets a 0.5 mg/L monthly average for conventional refinery outfalls, and the EU IED BAT-AEL range of 0.5–1.0 mg/L for total phosphorus (2024 BREF update) is heading toward 0.5 mg/L in the 2026 revision. Phosphorus was historically a non-target parameter in refinery design because API separators and dissolved air flotation (DAF) are tuned for free oil, emulsified oil, and dissolved oil — the three forms Yokogawa's 2020 refinery application note maps to the upstream end of the train — not for dissolved nutrients. The real failure mode in 2026 is post-nitrification: ammonia-nitrogen upgrade plants now reliably nitrify to <2 mg/L NH₃-N, but the resulting bioeffluent residual P of 1.5–4 mg/L still punches through the 0.5 mg/L TP ceiling. That is the gap an engineered phosphorus removal train has to close.
Phosphorus Speciation Across the Refinery Wastewater Train
Phosphorus enters a refinery wastewater train from four distinct streams, and the species distribution dictates which unit operation you can target. Desalter brine typically carries 5–20 mg/L TP, with roughly 90% as orthophosphate after the desalting mixing valve. Sour water stripper bottoms run 20–50 mg/L TP, dominated by polyphosphate and organic-P from amine degradation products. Spent caustic effluent, after biological oxidation of sulfides, still carries 10–30 mg/L TP, mostly as ortho-P. The combined API/DAF overflow — what most designers treat as "primary effluent" — runs 1–5 mg/L TP, but after emulsified-oil destabilization this stream blends with desalter and SWS bleed-offs to a composite primary feed of 5–60 mg/L TP, with 60–80% as orthophosphate because ortho-P is the truly dissolved fraction that survives the oil-removal stages (Yokogawa, 2020).
The design implication is that ortho-P must be the primary target: biological luxury uptake and chemical precipitation only act on the dissolved species, so any poly-P and organic-P must first be hydrolyzed in the activated-sludge aeration basin. The 95.1% TP removal benchmark from the Chromobacterium LEE-38 biofilm pilot (Springer, Biotechnology and Bioprocess Engineering) sets the credible upper bound for biological uptake on a low-strength feed at 30–40 °C and pH 6.0–8.0.
| Refinery stream | Typical TP (mg/L) | Dominant species | Recommended unit operation |
|---|---|---|---|
| Desalter brine | 5–20 | ~90% ortho-P | Pre-DAF coagulation |
| Sour water stripper bottoms | 20–50 | Poly-P / organic-P | EBPR with hydrolysis stage |
| Spent caustic (post-bioox) | 10–30 | Ortho-P dominant | Tertiary chemical precipitation |
| API/DAF overflow | 1–5 | Mixed (oil-coated) | Coagulation + DAF |
| Composite primary feed | 5–60 | 60–80% ortho-P | Full train |
Stage 1: Pre-DAF Coagulation for Particulate and Colloidal Phosphorus
DAF is already the workhorse after the API separator on most modern refineries, and adding coagulant dose to the saturator recycle converts it into a phosphorus-removal thickener rather than just an oil-polisher. The dose envelope for the refinery primary feed is polyaluminum chloride (PAC) at 15–40 mg/L or FeCl₃ at 20–50 mg/L, controlled to pH 6.5–7.5, which drives 70–85% capture of particulate and colloidal P into the float layer. The dissolved air flotation system covers 4–300 m³/h with 10–50 μm micro-bubbles, which is the right hydraulic envelope for either a single desalter side-stream or a full refinery primary feed. Coagulant delivery is best handled by a PLC-controlled chemical dosing skid tied to the flow-proportional control loop on the saturator water. Sludge production at this stage runs 0.3–0.6 kg dry solids per m³ treated, which is dewaterable on a standard plate-and-frame press without polymer optimization. The point of this stage is to protect downstream biology: dropping the particulate/colloidal P load to <1 mg/L before the aeration basin keeps the EBPR biomass from being poisoned by oil-coated particulates and prevents phosphate-driven struvite scaling in the centrifuges.
Stage 2: Biological Luxury Uptake (Enhanced Biological Phosphorus Removal)
Every modern refinery already runs an activated-sludge plant, and converting the existing aeration basin into an EBPR configuration is the lowest-capex step in the train. EBPR works by alternating anaerobic and aerobic zones so polyphosphate-accumulating organisms (PAOs) take up 3–5× their cell mass in polyphosphate under aerobic stress, yielding 80–95% TP removal at 30–40 °C, pH 6.5–7.5, and a BOD:P ratio of at least 20:1 (Springer biofilm pilot, 2000). The pilot benchmark is real: 90.0–96.4% TP removal at 30–55 °C with Chromobacterium LEE-38, and 95.1% on the optimized low-strength feed.
The two refinery-specific constraints are temperature ceiling and carbon limitation. Mixed-liquor temperatures above 40 °C inhibit PAO activity, and refinery sour-water stripper condensate can push basin temperatures past 42 °C in summer — the practical fix is to bypass SWS condensate around the aeration basin or install a cooling loop. On the carbon side, refinery bioeffluents are often BOD-limited at BOD:P ratios of 8–15:1, which is below the 20:1 threshold; methanol or acetate supplementation of 5–15 mg/L as supplemental COD is the standard fix. The MBR membrane bioreactor configuration tightens the EBPR footprint by retaining PAO biomass at high mixed-liquor suspended solids, which is the path to handling peak loads on a 5,000 m³/d refinery without building a second aeration basin.
PAO-rich waste activated sludge carries 4–6% P by dry weight, and that P is recoverable. The WAS stream should go to a dedicated gravity thickener, then to a plate-and-frame filter press to produce a 25–35% DS cake. On sites with on-site agricultural demand, the PAO-rich press cake can be land-applied as a low-grade P fertilizer, recovering roughly 8–14 tonnes/year of P₂O₅ at a 5,000 m³/d plant (HydropureWater field data, 2026).
Stage 3: Tertiary Chemical Polishing to ≤0.5 mg/L TP
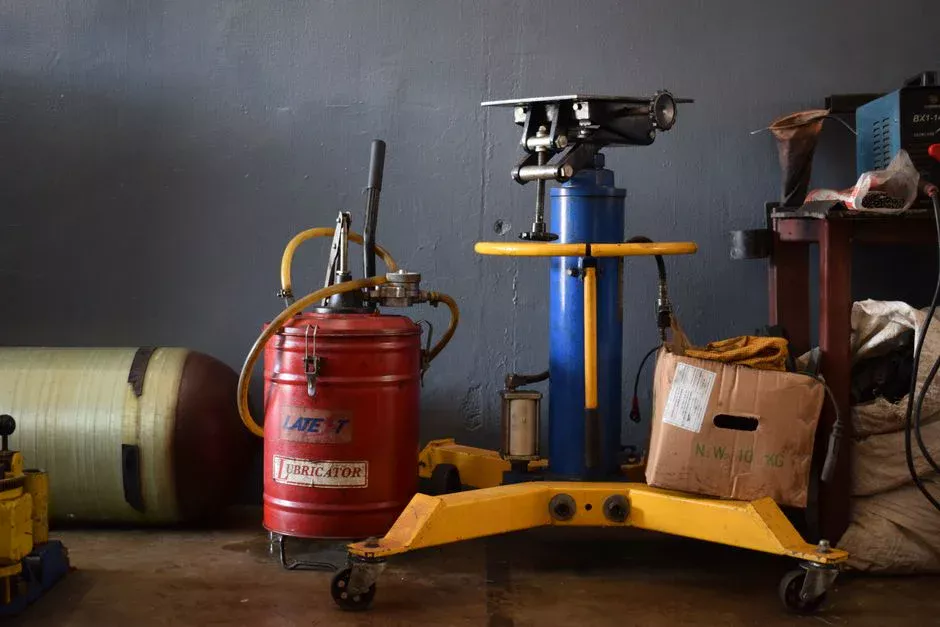
When the bioeffluent residual P still sits at 1.0–2.5 mg/L — which is the typical case when the upstream EBPR is loaded near capacity or running at the high end of the temperature envelope — a tertiary chemical precipitation stage is the only credible way to guarantee the 0.5 mg/L TP limit. The standard dose is FeCl₃ at 1.5–2.5 mol Fe per mol P, equivalent to 15–45 mg/L FeCl₃ on a 2 mg/L residual P feed, controlled to pH 6.5–7.5; this window achieves 90–98% removal of residual phosphate. The vegetable-oil refinery study (International Journal of Environmental, NaOH precipitation) reported 97.7% TP removal on a related oily matrix, which is the credible upper bound for the same chemical class on a petroleum-derived feed.
| Coagulant | Mole ratio (metal : P) | Dose range (mg/L as product) | Sludge yield (vs Fe baseline) | Typical removal |
|---|---|---|---|---|
| FeCl₃ | 1.5–2.5 mol Fe/mol P | 15–45 | 1.0× (baseline) | 90–98% |
| Alum (Al₂(SO₄)₃) | 1.2–2.0 mol Al/mol P | 20–55 | ~1.5× | 85–95% |
| PACl | 0.8–1.5 mol Al/mol P | 10–30 | ~0.7× | 88–96% |
Reactor design is straightforward: rapid mix for 1–2 minutes at G = 300–700 s⁻¹, flocculation for 15–30 minutes at G = 30–80 s⁻¹, then a high-efficiency lamella clarifier for sludge blanket control. Coagulant delivery on this stage should run through a PLC-controlled chemical dosing skid with phosphate-meter feedback trim, which holds the residual within ±0.1 mg/L of setpoint and prevents the overdose that drives OPEX on FeCl₃.
Stage 4: Final Filtration and Sludge Handling
The polish step is a multi-media filtration system loaded with 0.5–1.0 m of anthracite over sand over garnet, operated at 5–10 m/h, which guarantees effluent TP <0.3 mg/L even when the clarifier is at the edge of breakthrough. The filter also catches any colloidal P that slips through the chemical precipitation stage, and it is the right barrier ahead of any cooling-tower make-up or boiler-feed reuse line.
For sites targeting near-reuse quality, an optional DF-series flat-sheet MBR module at 0.1 μm removes the remaining colloidal fraction and tightens TP to <0.1 mg/L, at the cost of additional trans-membrane pressure management. The chemical P sludge from Stage 3 runs 2–4% DS and is thickened to 5–8% DS in a gravity thickener, then dewatered on a plate-and-frame filter press to a 25–35% DS cake for landfill, or — where the local permit allows — for land application as a low-grade P fertilizer. The combined chemical-and-disposal OPEX impact of Stage 3 + Stage 4 sludge handling is $0.08–$0.18 per m³ treated, dominated by FeCl₃ at $0.04–$0.07 per m³. For background on the polymer/flocculant cost envelope and the filter-press OPEX, see this polymer and flocculant cost optimization reference.
2026 Compliance Scorecard: Limits, Sludge, and Cost per m³
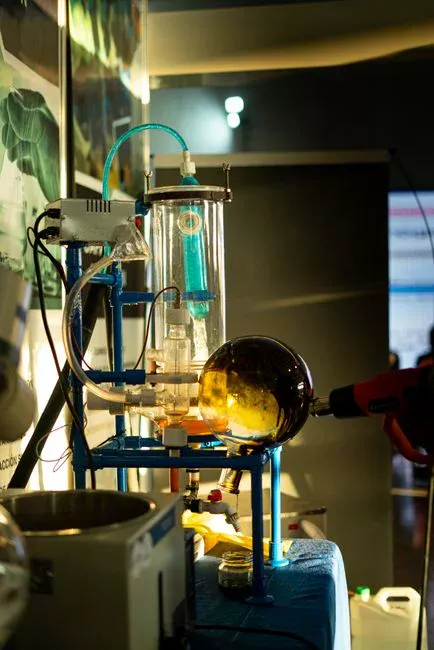
The compliance envelope and cost stack for a 5,000 m³/d retrofit.
| Parameter | China GB 31573-2024 | US EPA 40 CFR 435 Subpart A | EU IED BAT-AEL 2024 (2026 revision) |
|---|---|---|---|
| TP limit | ≤0.5 mg/L | 0.5 mg/L monthly avg | 0.5–1.0 mg/L (lower end tightening 2026) |
| Compliance year | 2026 (first full year) | Current | 2026 revision pending |
| CAPEX (5,000 m³/d retrofit) | $1.2–2.5M (DAF upgrade + EBPR conversion + lamella + filter) | ||
| OPEX | $0.18–0.32/m³ (chemicals 35–45%, energy 25–30%, sludge disposal 20–30%) | ||
| Recoverable P₂O₅ | 8–14 tonnes/year at 5,000 m³/d (struvite-precipitation-ready) | ||
For the US-side effluent framework, see this 2026 EPA industrial effluent limits by industry reference. For the analogous edible-oil matrix, the design patterns translate almost directly — see this edible oil wastewater phosphorus removal process guide. Middle Eastern refineries operating under PMC and SADARA frameworks should also review the parallel ammonia nitrogen discharge limits for Middle Eastern refineries — ammonia and phosphorus are the two nutrients that are now regulated in lockstep.
Frequently Asked Questions
Q1: What is the typical influent total phosphorus concentration in refinery wastewater?
The composite primary feed after API/DAF carries 5–60 mg/L TP, with 60–80% as orthophosphate once emulsified oil is destabilized (Yokogawa, 2020).
Q2: Can a refinery hit 0.5 mg/L TP without chemical dosing?
Only with EBPR plus an MBR polish; most sites need tertiary FeCl₃ at 1.5–2.5 mol Fe/mol P to guarantee compliance against the GB 31573 / 40 CFR 435 floor.
Q3: Which refinery stream contributes the most phosphorus?
Sour water stripper bottoms (20–50 mg/L TP, poly-P/organic-P) is the largest single contributor, followed by desalter brine (5–20 mg/L TP, ~90% ortho-P).
Q4: Why does EBPR underperform in summer?
Mixed-liquor temperatures above 40 °C inhibit PAO activity (Springer biofilm pilot, 2000); the fix is to bypass SWS condensate around the aeration basin or install basin cooling.
Q5: Is chemical P sludge hazardous?
Not classified hazardous in most jurisdictions, but the cake is high in iron/aluminum hydroxides; it is suitable for landfill after plate-press dewatering to 25–35% DS, and is land-applicable as a low-grade P fertilizer where local permits allow.