Why Paper Mill Wastewater Demands a Dedicated Treatment Train
A Kraft mill discharges 10–60 m³ of effluent per ton of paper produced, while a recycled paper mill releases 5–30 m³/t — and that flow carries four overlapping pollutant categories that a single unit operation cannot treat: high COD/BOD from black liquor and cooking chemicals, suspended fibers and fines, color from lignin-derived chromophores, and nutrients plus chloride from bleaching sequences. Black liquor alone represents the dominant organic load; the recovery boiler in a Kraft mill captures most of it, but evaporator condensates and spill events still push COD above 6,000 mg/L in the combined mill sewer. Without in-mill segregation — black liquor to recovery, white water to fiber-recovery loop, bleach plant effluent isolated for AOX polishing — every downstream unit runs overloaded. The Chinese-language literature on tissue-mill white water treatment and the long-standing upflow anaerobic digester (UAD) neutralization of paper mill black liquor both reinforce the same engineering precedent: characterize, segregate, then treat. A "treat-it-all-in-one-basin" approach fails the moment the mill exceeds its daily production rate.
Influent Characterization: What Comes Out of Each Paper Mill Stream
Designing a treatment train starts with the four streams a mill actually produces, not a generic COD number. The table below compiles typical influent ranges drawn from municipal Kraft, mechanical pulping, recycled paper, and bleach plant streams (HydropureWater field data, 2026; consistent with the ScienceDirect 2024 ASM1 calibration study on a Finnish paper mill WWTP, which showed that proper influent fractionation of the slowly biodegradable COD fraction is mandatory before sizing aeration basins).
| Stream | COD (mg/L) | BOD (mg/L) | TSS (mg/L) | Color (CU) | pH | Temp (°C) |
|---|---|---|---|---|---|---|
| Kraft black liquor (evaporator condensate) | 5,000–25,000 | 2,000–10,000 | 1,000–3,000 | 50,000–150,000 | 11–13 | 55–80 |
| Mechanical pulping white water | 2,000–5,000 | 800–2,500 | 500–2,500 | 1,500–4,000 | 6–8 | 35–55 |
| Recycled paper mill effluent | 1,500–4,000 | 600–1,800 | 300–1,500 | 500–2,000 | 6.5–8.5 | 30–45 |
| Bleach plant effluent (CEH, ECF) | 1,200–3,500 | 400–1,200 | 200–800 | 2,000–6,000 | 2–5 | 40–60 |
Two implications follow. First, the combined raw influent to the wastewater plant usually lands at 1,500–6,000 mg/L COD, 30–200 mg/L TSS after primary clarification, and pH 6–9 once streams are blended. Second, bleached mills carry adsorbable organically bound halogens (AOX) of 5–30 mg/L — that single number pushes the tertiary stage toward activated carbon, persulfate AOP, or RO rather than simple chlorination. Before any of this reaches the aeration tank, the headworks needs a GX series rotary bar screen for headworks protection sized to 3–10 mm openings to catch plastics, rags, and rope that otherwise jam DAF scrapers.
Primary Treatment: Fiber Recovery with Rotary Screens and DAF
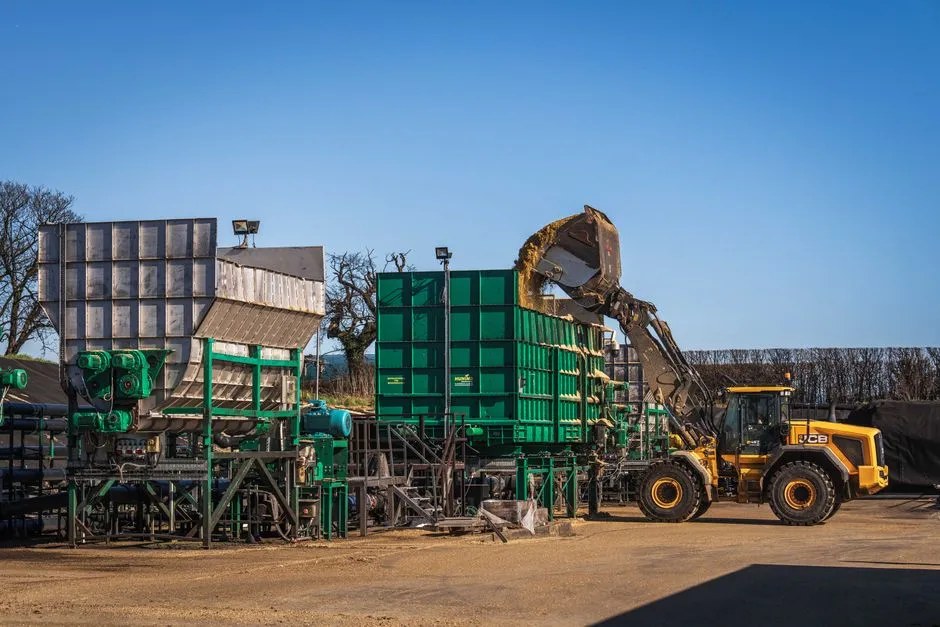
Primary clarification in a paper mill is not a sediment basin — it is a fiber-recovery stage that pays for itself. After bar screening, dissolved air flotation is the workhorse: a well-designed DAF removes 90–95% of TSS and 70–85% of COD from white water while recovering saleable fiber that goes back to the headbox. A DAF system for paper mill white water rated 4–300 m³/h operates at hydraulic residence time 20–30 min, air-to-solids ratio (A/S) of 0.005–0.015, and microbubble size 10–50 µm — that bubble range is what makes DAF outperform induced-air flotation on colloidal fiber, which never settles in a clarifier. The floated skimmings typically discharge at 2–4% dry solids and drop directly into a sludge handling line; the underflow stream carries clarified water to biological treatment with COD already cut by two-thirds. The economic logic is simple: every kilogram of fiber recovered at the DAF is a kilogram that never has to be paid for at the fresh-pulp chest, and every kilogram of COD removed at primary is a kilogram that does not need aeration, nutrients, and electrical power downstream.
Secondary Treatment: A2O, SBR, or MBR for COD and Nutrient Removal
Biological treatment is the highest-impact capital decision in the train. Three configurations dominate the 2026 paper mill market, and the choice depends on footprint, flow variability, and whether the effluent is destined for discharge or reuse.
| Process | HRT (h) | MLSS (mg/L) | COD removal | Footprint vs CAS | Best fit |
|---|---|---|---|---|---|
| A2O (anaerobic/anoxic/aerobic) | 12–36 | 3,000–5,000 | 85–95% | 1.0× (baseline) | Large Kraft mills, stable flow, nutrient limits |
| SBR / CASS (batch) | 24–48 cycle | 3,500–5,500 | 80–90% | 0.7× | Small/medium tissue mills, intermittent flow, no separate clarifier |
| MBR (membrane bioreactor) | 8–18 | 6,000–12,000 | 95–99% | 0.4× | Space-constrained retrofits, water reuse, tight TSS limits |
A2O remains the conventional choice for Kraft mills with continuous flow and a TN/TP permit limit. SBR (or its continuous-actor variant CASS) fits smaller tissue mills that operate one or two shifts and produce a slug flow. For a 2026 retrofit or a mill targeting reuse, MBR is the default: submerged PVDF flat-sheet membranes at 0.1 µm cut effluent COD to ≤50 mg/L and TSS to ≤5 mg/L in a footprint roughly 60% smaller than conventional activated sludge. An integrated MBR system for paper mill reuse-grade effluent running with DF series PVDF flat sheet membrane modules operates at sustained flux 10–20 L/m²·h, which is the design range for paper-mill feed (lower than municipal 15–25 L/m²·h because of residual colloidal lignin). The Ahmed & Vilkko ScienceDirect 2024 ASM1 calibration study is the engineering point that matters here: municipal default kinetic parameters under-predict the slowly biodegradable fraction in paper-mill wastewater, so aeration tank sizing must be tuned to mill-specific respirometry, not text-book defaults.
Tertiary Polishing: Filtration, AOP, and Reuse-Ready Disinfection
Tertiary polishing closes the gap between biological effluent and either a discharge permit or a reuse loop. Multi-media filtration (sand + anthracite + garnet) drops TSS below 5 mg/L and protects downstream reverse osmosis from fouling; a multi-media filter for RO protection is non-negotiable on any reuse train. For color and refractory COD, advanced oxidation is the standard. The Can-Guven et al. 2021 study in Environmental Progress & Sustainable Energy (vol. 40, no. 2) demonstrated Fe²⁺/heat-activated persulfate achieving >80% COD removal on paper mill effluent, with a pseudo-first-order rate constant that scales with persulfate dose up to the radical-scavenging limit — a useful design anchor when sizing UV/H₂O₂ or ozone reactors as the commercial alternative. Industrial RO for paper mill reuse water on tertiary feed typically runs at 65–75% recovery (well below the 95% brackish-water number, because of higher scaling potential and higher organics). For disinfection in a reuse loop, ClO₂ has replaced chlorine in 2026 because it controls biofilm inside paper machine white water systems without raising AOX the way Cl₂ does; a chlorine dioxide generator for paper mill reuse loops sized at 0.5–2.0 mg/L residual typically meets the ≤200 CFU/100 mL fecal coliform target without oxidizing bromide.
Sludge Handling and Chemical Dosing Across the Train
Liquid treatment is only half the budget. A paper mill treatment train produces 0.3–0.8 kg dry solids per ton of paper after DAF plus biological stages — fiber sludge from primary, waste activated sludge from biological, and chemical precipitates from tertiary coagulation. A plate and frame filter press for paper mill sludge dewaters the combined sludge to 30–40% dry solids, producing a cake that can be landfilled, incinerated with bark, or, in integrated mills, returned to the chemical recovery loop. On the dosing side, performance is not stable without automatic chemical feed: coagulant (PAC 50–300 mg/L) and flocculant (cationic polyacrylamide 1–5 mg/L) at the DAF, nutrient dosing at the aeration basin, pH correction between primary and biological, and antiscalant ahead of RO. An automatic chemical dosing system for coagulant and pH control is the lowest-cost insurance against DAF failure and RO fouling — both of which are the most common causes of unplanned downtime in a paper mill ETP.
Process Selection Matrix: Matching Train to Mill Type
Shortlisting equipment is faster with a one-glance matrix. The recommendation below assumes a mill trying to meet 50–100 mg/L COD discharge (or stricter reuse targets where flagged), under EPA 40 CFR Part 430, EU IED 2010/75/EU, or China GB 3544 limits.
| Mill type | Primary | Biological | Tertiary | Sludge | Reuse potential |
|---|---|---|---|---|---|
| Kraft (integrated, bleached) | DAF | A2O | MMF + AOP / GAC | Filter press | Limited (high AOX) |
| Recycled paper (OCC, mixed) | Bar screen + DAF | MBR | MMF + RO | Filter press | High (50–70% reuse) |
| Tissue (small/medium) | Bar screen + DAF | SBR / CASS | MMF + ClO₂ | Filter press | Moderate (30–50%) |
| Mechanical pulp (BCTMP, SGW) | DAF | A2O + RO | MMF + AOP | Filter press | High (process water) |
For deeper biological-stage design context, the BOD removal from industrial wastewater 2026 guide covers kinetic parameters and MLSS control in more detail.
2026 CAPEX and OPEX Benchmarks for a Paper Mill Treatment Train
Order-of-magnitude numbers, drawn from project data 2024-Q4 through 2026-Q2 (HydropureWater project pipeline; consistent with the 2026 CAPEX/OPEX benchmarks in the effluent treatment plant cost 2026 breakdown):
| Mill scenario | Flow | CAPEX (USD) | OPEX (USD/m³) | Payback driver |
|---|---|---|---|---|
| Recycled paper, 50 m³/h, full train + reuse | 50 m³/h | $350K–$900K | $0.20–$0.45 | Fiber recovery + 60% freshwater offset |
| Kraft, 200 m³/h, full train + AOX polishing | 200 m³/h | $1.5M–$4.0M | $0.35–$0.70 | Compliance + reduced sewer surcharge |
| Tissue, 25 m³/h, DAF + SBR + ClO₂ | 25 m³/h | $180K–$450K | $0.25–$0.55 | Sewer fee avoidance |
Water reuse is the single largest OPEX offset. A 40–70% freshwater reduction at $0.50–$1.50/m³ — typical industrial water tariffs in 2026 — typically displaces 30–60% of the treatment train OPEX within 3–5 years. The cross-industry reuse logic for high-COD streams is detailed in the printing and dyeing wastewater recycling 2026 guide, which translates directly to paper mill white water loops.
Frequently Asked Questions
What discharge standards apply to paper mill effluent in 2026? U.S. mills fall under EPA 40 CFR Part 430 (Pulp, Paper and Paperboard point source category), with BOD and TSS limits set by subcategory. EU mills comply with Industrial Emissions Directive 2010/75/EU BAT-AEL ranges, typically 20–50 mg/L COD for direct discharge. Chinese mills follow GB 3544-2008 (updated 2024 amendments) with COD ≤80 mg/L and AOX ≤12 mg/L for bleached lines.
How much footprint does an MBR save versus conventional activated sludge in a paper mill retrofit? An MBR operating at MLSS 6,000–12,000 mg/L and flux 10–20 L/m²·h cuts aeration tank volume by roughly 40–60% versus a CAS basin at 3,000–5,000 mg/L MLSS, with the additional footprint saving from eliminating a secondary clarifier.
Is DAF enough on its own, or is biological treatment always required? DAF removes 90–95% TSS and 70–85% COD, but the residual 200–500 mg/L COD plus the slowly biodegradable fraction from black liquor and lignin derivatives require a downstream biological stage to reach 50–100 mg/L discharge targets; DAF alone is fiber-recovery, not compliance.