What Does a 10,000 m³/Day Sewage Treatment Plant Actually Cost in 2026?
A 10,000 m³/day sewage treatment plant costs between $1.2M and $8.5M of CAPEX in 2026, depending on process train: conventional A2O sits at $1.2M–$2.5M, MBBR at $1.8M–$3.5M, SBR at $2.0M–$4.0M, and MBR at $3.5M–$8.5M. OPEX runs $0.18–$0.42/m³, with MBR adding $0.05–$0.09/m³ for membrane replacement every 5–8 years. Energy demand lands between 0.45 and 0.75 kWh/m³ depending on influent BOD and aeration efficiency.
Four drivers explain the spread between the low and high ends of the band. Influent load — moving from COD 250 to 500 mg/L typically increases aeration tank volume by 40–60%, and that directly scales blower sizing, reactor steel, and civil footprint. Effluent standard — China GB 18918-2002 Class 1A discharge versus an industrial reuse target to feed cooling-tower make-up changes the entire downstream process train and pushes the project from A2O to MBR + RO polishing. Automation level — a PLC panel with hard-wired instruments costs $80K–$120K; a full SCADA system with remote telemetry runs $200K–$250K at this scale. Geographic logistics — inland Middle East or remote Southeast Asia sites add 8–18% to equipment cost for containerization, transport insurance, and on-site erection crews.
Made-in-China and Directindustry aggregator pages only list product catalog entries with no engineering — they show a blower, a membrane module, a filter press, but never tie them into a process train or a CAPEX breakdown. The engineering-led cost model behind this 2026 industrial wastewater treatment market trends analysis treats scope as the real cost variable.
One more lever that buyers routinely miss: contract scope. An EP (engineering + procurement) package sits roughly 10–15% below an EPC (engineering, procurement, construction) turnkey contract, and a turnkey with 24-month performance guarantee runs another 5–10% above standard EPC. Before comparing two quotes at 10,000 m³/d, lock down whether civil works, commissioning, and two years of spares are inside the number.
Process Selection at 10,000 m³/Day: A2O vs MBBR vs SBR vs MBR
Process choice at 10,000 m³/d is driven by three binding constraints: the effluent target in the discharge permit, the available site footprint, and the influent variability. China GB 18918-2002 Class 1A and EU UWWTD 91/271/EEC for agglomerations above 10,000 PE both require TN ≤15 mg/L — that rules out conventional activated sludge and pushes the decision toward A2O, MBBR, SBR, or MBR.
| Parameter | A2O | MBBR | SBR | MBR |
|---|---|---|---|---|
| Effluent BOD (mg/L) | <10 | <10 | <10 | <5 |
| Effluent COD (mg/L) | <50 | <50 | <50 | <30 |
| Effluent TN (mg/L) | <15 | <20 | <15 | <10 |
| Effluent TP (mg/L) | <0.5 (with chem P) | <1.0 | <0.5 (with chem P) | <0.5 |
| Footprint (m²/m³/d) | 0.5–0.7 | 0.3–0.45 | 0.4–0.6 | 0.2–0.3 |
| CAPEX 2026 (USD) | $1.2M–$2.5M | $1.8M–$3.5M | $2.0M–$4.0M | $3.5M–$8.5M |
| OPEX 2026 ($/m³) | $0.18–$0.25 | $0.22–$0.32 | $0.20–$0.30 | $0.28–$0.42 |
| Best-fit application | Municipal Class 1A discharge | Retrofits, variable loads | Industrial parks, shock loads | Reuse, tight sites |
A2O is the workhorse for municipal plants chasing Class 1A discharge. The biological nutrient removal trains anaerobic, anoxic, and aerobic zones in series; a chemical phosphorus precipitation step with PAC closes the TP gap. It is the lowest CAPEX option in the matrix.
MBBR trades a 20–30% higher CAPEX for a 40% smaller footprint and far better tolerance of hydraulic and organic shocks — the moving-bed biofilm carriers ride through influent spikes that would wash out a suspended-growth system. It is the right call when the plant is being retrofitted into an existing footprint or paired with a sidestream from an industrial park.
SBR runs in time rather than space: a single tank sequences fill, react, settle, and decant. That batch flexibility is the reason food and dairy processors pick SBR — shock loads from CIP cycles and seasonal production do not upset the biology. Internal SBR-for-dairy benchmarks (HydropureWater field data) show 10,000 m³/d dairy SBR plants delivered in the $1.2M–$6.5M band depending on equalization and biogas capture scope.
MBR pairs a conventional activated-sludge bioreactor with an MBR integrated wastewater treatment system using 0.1 µm PVDF ultrafiltration membranes. The membrane barrier holds all suspended solids and most colloids back, so BOD drops below 5 mg/L and TN can be pushed below 10 mg/L with extended anoxic zones. The 60% footprint reduction over A2O matters on tight urban sites, and it is the only option in the matrix that produces reuse-quality water without a downstream RO.
Anatomy of a 10,000 m³/Day Plant: Equipment Line Items and Their Cost Share
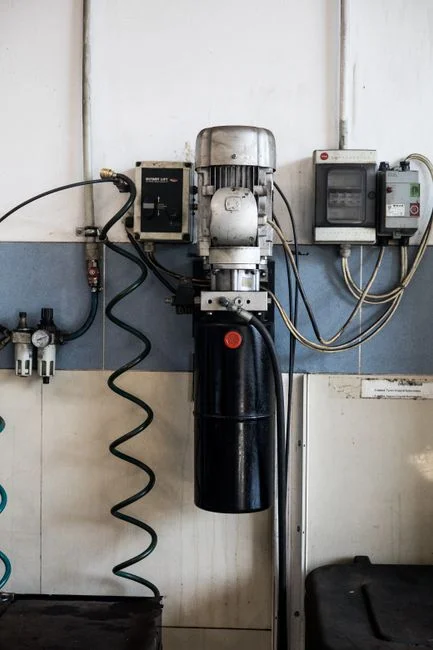
CAPEX audits fail when buyers compare lump sums. The line-item breakdown below is what a defensible RFQ evaluation looks like at 10,000 m³/d, stated as percentage of total CAPEX and as a 2026 USD range across all four process trains.
| Line item | % of CAPEX | USD range (10,000 m³/d) | Driver |
|---|---|---|---|
| Civil works and earthwork | 25–35% | $0.40M–$2.50M | Soil, seismic zone, dewatering |
| Biological reactor tanks | 15–20% | $0.25M–$1.50M | Concrete vs. steel, HRT |
| Membrane cassettes (if MBR) | 15–25% | $0.50M–$2.00M | Flux, PVDF grade |
| Aeration blowers and diffusers | 8–12% | $0.15M–$0.80M | Aeration tank volume |
| Sludge dewatering | 5–10% | $0.10M–$0.60M | Cake dryness target |
| Disinfection (UV / ClO₂) | 3–5% | $0.05M–$0.30M | Reuse vs. discharge |
| SCADA and instrumentation | 4–7% | $0.08M–$0.40M | PLC vs. full SCADA |
| Pre-treatment screening | 2–4% | $0.03M–$0.20M | Bar spacing, peak flow |
Civil works are the single largest line and the most site-dependent. A plant on sandy soil with no seismic requirement can land at 25% of CAPEX; a plant on soft clay with a Zone 4 seismic code and a 6 m excavation dewatering budget will push past 35%. The other big swing factor is the membrane cassette count for an MBR plant — DF series PVDF flat sheet membrane modules deliver 32–135 m³/d per module, so a 10,000 m³/d MBR train needs on the order of 75 to 310 modules depending on the selected flux and redundancy. Pre-treatment with a rotary mechanical bar screen at 3–6 mm spacing protects those modules from fibrous carryover and is non-negotiable for any MBR. Sludge dewatering — a plate and frame filter press delivering ≥22% dry solids — keeps sludge hauling off the OPEX line item.
5-Year OPEX Model: Energy, Chemicals, Membranes, and Labor
CAPEX is the number a finance committee signs off on; OPEX is the number the operations team has to live with for 20+ years. The 5-year lifecycle model below turns the headline CAPEX into a defensible total cost of ownership at 10,000 m³/d.
| OPEX component | Unit cost | A2O ($/m³) | MBR ($/m³) | Notes |
|---|---|---|---|---|
| Energy | 0.45–0.75 kWh/m³ × $0.08–$0.12/kWh | $0.04–$0.07 | $0.05–$0.09 | ~60% to aeration blowers |
| Chemicals (PAC, NaOCl/ClO₂, CIP) | — | $0.03–$0.05 | $0.04–$0.07 | Higher for MBR CIP |
| Membrane replacement (amortized) | $50–$80/m² every 5–8 yr | — | $0.05–$0.09 | PVDF cassette replacement |
| Sludge disposal | Haul + tipping | $0.02–$0.05 | $0.02–$0.06 | Target ≥22% DS via filter press |
| Labor + maintenance | 2–4 FTE × $15K–$30K/yr | $0.01–$0.02 | $0.01–$0.03 | 10,000 m³/d operating base |
| 5-year total OPEX | — | $3.3M–$4.6M | $5.1M–$7.7M | Includes 1 membrane cycle |
The energy line is dominated by aeration — typically 55–65% of plant power, which is why blower selection and dissolved-oxygen control are the most leveraged OPEX decisions a buyer makes. Membrane replacement in MBR is the single most predictable OPEX shock: a properly operated PVDF cassette lasts 5–8 years, and the UF spare parts and consumables cost 2026 reference data puts the all-in replacement at $50–$80/m² of membrane area installed.
Over a 5-year window, A2O lands at $3.3M–$4.6M of OPEX while MBR lands at $5.1M–$7.7M. The CAPEX premium for MBR ($2.3M–$6.0M above A2O) narrows by roughly 30–40% once the 5-year OPEX differential and the avoided tertiary filtration CAPEX are folded in. For reuse-driven sites, that gap closes further when the MBR effluent replaces purchased potable or demin water.
Compliance and Effluent Targets: Matching the Plant to the Standard
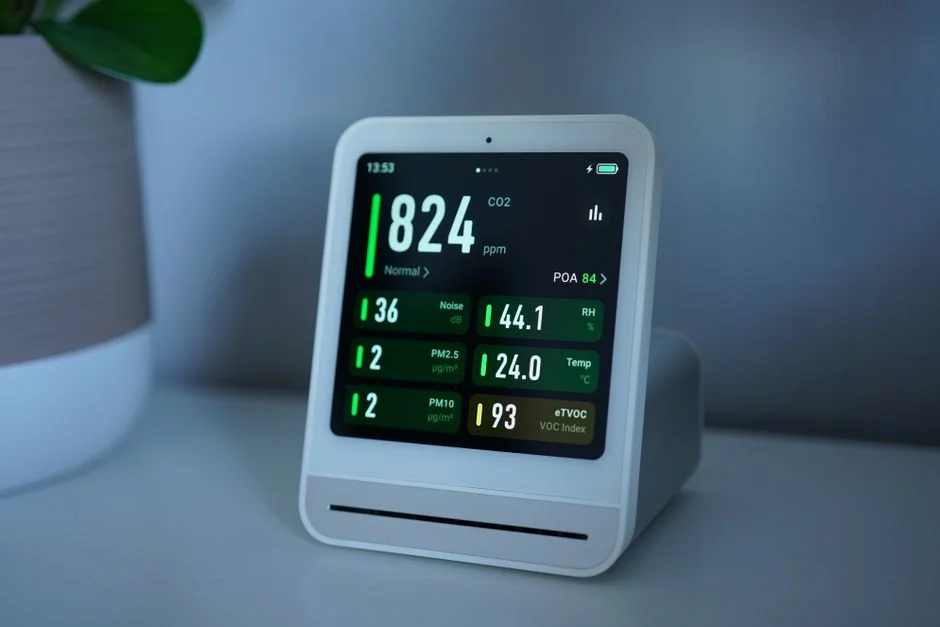
China GB 18918-2002 Class 1A is the tightest baseline in the matrix: COD <50 mg/L, BOD <10 mg/L, NH₃-N <5 mg/L, TN <15 mg/L, TP <0.5 mg/L. An A2O train with chemical phosphorus precipitation using PAC at 15–30 mg/L meets all five parameters, which is why A2O remains the default for municipal Class 1A discharge in China.
EU UWWTD 91/271/EEC for agglomerations above 10,000 PE sets BOD <25 mg/L, COD <125 mg/L, and TSS <35 mg/L — looser on nitrogen and phosphorus than GB 18918-2002 Class 1A. MBBR or A2O meets UWWTD comfortably without chemical P polishing in most cases, which is why MBBR dominates Nordic and Eastern European retrofits.
US EPA secondary treatment under 40 CFR 133 sets BOD <30 mg/L and TSS <30 mg/L — a conventional activated-sludge or SBR plant with primary clarification is sufficient, and there is no federal TN/TP limit (those are state-by-state). Industrial reuse targets — cooling-tower make-up, boiler feed, or unrestricted irrigation — typically require MBR followed by RO polishing to hit TDS, conductivity, and pathogen log-removal targets.
Where pathogen control is the binding constraint (hospital, pharmaceutical, food processors discharging to a reuse line), a parallel benchmark worth tracking is the disinfection train pairing ClO₂ generation with MBR polishing, which delivers the <5 mg/L BOD and near-zero coliform envelope most reuse permits demand.
Regional Price Adjustments and Vendor Selection Checklist
Geography shifts the global CAPEX band by 10–25%. Southeast Asia (Vietnam, Indonesia, Philippines) typically runs Chinese or local supply at 10–20% below the global median CAPEX, but membrane replacement logistics are longer and site erection crews need closer supervision. Middle East projects (Qatar, Saudi Arabia, UAE) usually require EPC turnkey contracts at a 15–25% CAPEX premium to cover hot-climate design (ambient >45 °C), higher automation, and often a ZLD polishing train — see the 2026 buyer guide for wastewater treatment plant suppliers in Qatar for a worked regional example. Latin America (Colombia, Brazil, Mexico) typically uses a hybrid EU/Chinese supply chain that lands 5–15% above Asian prices but with stronger local service networks.
Before signing any RFQ, run the vendor through this 10-point checklist:
- In-house membrane manufacturing (not trading)
- ≥5 reference plants at ≥5,000 m³/d in the last 5 years
- ISO 9001 + ISO 14001 certified
- On-site commissioning included in the EPC scope
- Minimum 2-year mechanical warranty, 1-year process warranty
- Performance guarantee bonded (L/C or parent-company guarantee)
- Remote SCADA option with at least 12 months of cellular telemetry included
- Spare parts lead time <2 weeks to the project site
- Demonstrated EPC capability — not a broker or trading house
- Bankable LCs accepted from a Tier-1 issuing bank
Red flag: any vendor quoting under $1.0M for a 10,000 m³/d plant is missing civil works, MBR cassettes, or both. Walk away, regardless of how polished the catalog page looks. For a deeper look at the trade-off between a packaged skid and a stick-built conventional plant, the package plant vs conventional treatment plant comparison covers the decision logic in detail.
Frequently Asked Questions
How much does a 10,000 m³/day sewage treatment plant cost? Between $1.2M and $8.5M of CAPEX in 2026. A2O runs $1.2M–$2.5M, MBBR $1.8M–$3.5M, SBR $2.0M–$4.0M, and MBR $3.5M–$8.5M. OPEX is $0.18–$0.42/m³ depending on process.
What is the difference between MBR and conventional activated sludge for 10,000 m³/d? MBR adds 0.1 µm PVDF membranes after the aeration tank, cutting footprint by ~60% and pushing effluent BOD below 5 mg/L and TN below 10 mg/L. It adds $0.05–$0.09/m³ of OPEX for membrane replacement every 5–8 years and roughly doubles CAPEX versus A2O.
How much land does a 10,000 m³/day STP need? Approximately 5,000–7,000 m² for an A2O plant (0.5–0.7 m²/m³/d) and 2,000–2,800 m² for an MBR plant (0.2–0.3 m²/m³/d). SBR lands in the 4,000–6,000 m² range, MBBR in the 3,000–4,500 m² range.
What is the payback period for a 10,000 m³/d reuse plant? Industrial reuse against purchased potable or demin water typically pays back in 4–7 years; municipal tariff recovery (where the reclaimed water is sold at a discount to the potable tariff) typically runs 8–12 years, depending on the local tariff structure and the avoided discharge penalty.
How long does it take to build a 10,000 m³/d sewage treatment plant? Civil works and tank construction take 10–14 months; mechanical, electrical, and membrane installation adds 3–5 months; commissioning and performance testing add another 1–3 months. A realistic total is 14–20 months from breaking ground to guaranteed performance.