What Makes Foundry Wastewater COD Hard to Treat
Chemical oxygen demand is defined as the milligrams of oxygen per liter required to oxidize all soluble and insoluble organics in a wastewater sample, with the standard test completing in roughly two hours and typically correlating with BOD results (alarcorp.com/chemical-oxygen-demand-cod/). In an iron and steel foundry the COD that shows up on the lab sheet is not a single number — it is a mixture of at least four carriers that behave differently in any unit operation: phenols liberated from resin binders during pour and shake-out, free and emulsified oil and grease from quenching and die release, suspended sand and slag carryover, and dissolved heavy metals.
A 1995 study on a real foundry wastewater quantified the phenol fraction at 3.5 mM, equal to 330 mg/L expressed as phenol, and used that as the calibration point for the rest of the treatment work (Water Research 1995, ScienceDirect 0043135495002375). That same study also showed why a one-step design fails: high-purity horseradish peroxidase removed over 65% of the raw COD, but a low-purity enzyme stock added so much organic load to the reactor that no net COD reduction was achieved at all. The lesson for a 2026 design is that the COD train is only as good as its weakest carrier — and the carriers each demand their own unit operation.
Why Foundries Need a Multi-Stage Treatment Train in 2026
Foundry managers in 2026 are not buying a single reactor; they are building a compliance strategy, and that strategy is a train. The sequence that has become standard is equalization first, then dissolved air flotation to strip free oil, FOG, and floatable grit, followed by pH conditioning, then a Fenton or electrocoagulation step for dissolved COD and phenols, then biological or MBR polishing, with sludge dewatering at the back end. The justification is numerical. The Wasit electrochemical study on an oily petroleum matrix reported 99.5% COD removal and 94.2% oil removal from a 710 mg/L COD feed at 12 kWh/m³ (Wasit University, doi 10.31185/ejuow.vol11.iss1.433). That figure sets a realistic ceiling for an advanced-oxidation or electrochemical stage — but it was reached on a 2 L cell, on a feed that was already relatively clean (73 mg/L TSS) and contained no foundry-specific binders. The 1995 enzyme study makes the same point from the other side: even with 97–99% phenol removal, residual COD in the best run was still 35% of the raw strength, so the downstream biological or membrane stage has to be sized for that load rather than ignored (Water Research 1995, ScienceDirect 0043135495002375). Tighter 2026 sewer-pretreatment limits and zero-liquid-discharge reuse targets in many jurisdictions are the reason foundries are now retrofitting DAF and advanced oxidation in front of legacy chemical precipitation, as detailed in a 2026 pretreatment compliance guide for fabricated metals plants.
DAF as the First COD Knockout for Oil, Grease and Solids
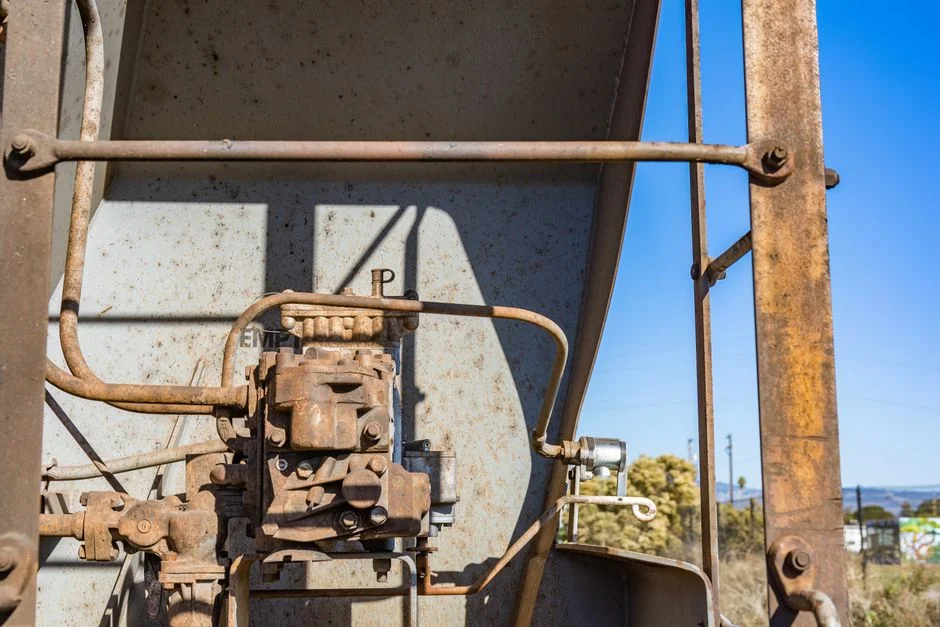
Front-end dissolved air flotation is the unit operation that protects every downstream chemical and electrochemical stage. By generating a blanket of micro-bubbles that lifts free and emulsified oil, FOG, and floatable grit to the surface, DAF removes the COD fraction that would otherwise consume Fenton peroxide, passivate electrocoagulation electrodes, or blind an MBR. Commercially available DAF skimmers range from small 4 m³/h units to large 300 m³/h systems with automatic skimming and are proven in metalworking, food, and petrochemical pre-treatment, so the technology itself is not the risk. The risk is sizing: hydraulic load, FOG fraction, and whether coagulant or polymer dosing is added inline all have to be defined before a DAF quote is meaningful. That checklist of inputs — flow profile, oil and grease percentage, peak-to-average ratio, polymer chemistry — is what the supplier needs to hear before the conversation turns to removal guarantees. Importantly, the 12 kWh/m³ electrocoagulation benchmark cited earlier assumes a feed with only 73 mg/L TSS, so a DAF system for foundry oil and grease removal has to knock out the floatable load first or the downstream energy bill will balloon.
Fenton Oxidation for Phenol-Driven COD
Fenton chemistry — Fe²⁺ catalyzing hydrogen peroxide to hydroxyl radical — is the workhorse for the dissolved COD and phenol fraction that DAF cannot touch. The mechanism is what makes it work on resin binder residues: the •OH radical attacks aromatic rings and breaks them into lower-COD organic acids that biological polishing can metabolize. Compared with the 1995 horseradish peroxidase result, where 97–99% phenol removal was achieved on a 330 mg/L phenol feed, Fenton has the advantage of being industrially available today while the enzyme route still requires further reductions in enzyme cost to compete economically (Water Research 1995, ScienceDirect 0043135495002375). The operating envelope is well defined in principle — acidic pH, stoichiometric H₂O₂ dosing relative to measured COD, a defined Fe²⁺ catalyst dose, and a neutralization stage before discharge or biological polishing — but exact reagent ratios must be set by jar tests on the specific foundry stream rather than borrowed from a textbook. The failure mode operators most often miss is residual peroxide: overdosing H₂O₂ raises the apparent COD on the lab sheet and can bleach downstream UV sensors or oxidize MBR membranes, so a PLC-controlled chemical dosing system for Fenton reagent control with a residual peroxide interlock is part of the design, not an optional extra.
Electrocoagulation and Electrooxidation for Foundry COD
The Wasit 2 L cell result is the headline number any supplier will quote: 99.5% COD removal and 94.2% oil removal from a 710 mg/L COD, 95 mg/L oil feed using 4 aluminium and 4 iron electrodes at a 2 cm gap, 12 cm submergence depth, 10.5 V, pH 7, 0.5 g/L NaCl, 50 minutes, and an energy consumption of 12 kWh/m³ (Wasit University, doi 10.31185/ejuow.vol11.iss1.433). That is a legitimate technical ceiling, but the feed is an oily petroleum matrix, not a foundry stream, so the figure should be used to anchor expectations, not to write a guarantee. The design checklist a buyer should put in front of any electrocoagulation supplier is fixed: electrode material and configuration, current density, inter-electrode gap, supporting electrolyte dose (NaCl or alternative), hydraulic retention time, and the sludge generation rate from Al and Fe hydroxide floc. The trade-off is the 12 kWh/m³ line on the OPEX — defensible when the foundry has cheap power and a strict reuse target that justifies shrinking the downstream biological stage, and harder to justify when power costs are high. The table below sets out the operating envelope from the Wasit study so the foundry engineer can see the gap between the 2 L cell and a real plant.
| Parameter | Value (Wasit 2 L cell) | Source |
|---|---|---|
| Reactor volume | 2 L | Wasit University, doi 10.31185/ejuow.vol11.iss1.433 |
| Electrode configuration | 4 Al + 4 Fe | Wasit University, doi 10.31185/ejuow.vol11.iss1.433 |
| Inter-electrode gap | 2 cm | Wasit University, doi 10.31185/ejuow.vol11.iss1.433 |
| Submergence depth | 12 cm | Wasit University, doi 10.31185/ejuow.vol11.iss1.433 |
| Voltage | 10.5 V | Wasit University, doi 10.31185/ejuow.vol11.iss1.433 |
| pH | 7 | Wasit University, doi 10.31185/ejuow.vol11.iss1.433 |
| NaCl dose | 0.5 g/L | Wasit University, doi 10.31185/ejuow.vol11.iss1.433 |
| Reaction time | 50 min | Wasit University, doi 10.31185/ejuow.vol11.iss1.433 |
| Influent COD | 710 mg/L | Wasit University, doi 10.31185/ejuow.vol11.iss1.433 |
| Influent oil | 95 mg/L | Wasit University, doi 10.31185/ejuow.vol11.iss1.433 |
| Influent TSS | 73 mg/L | Wasit University, doi 10.31185/ejuow.vol11.iss1.433 |
| COD removal | 99.5% | Wasit University, doi 10.31185/ejuow.vol11.iss1.433 |
| Oil removal | 94.2% | Wasit University, doi 10.31185/ejuow.vol11.iss1.433 |
| Energy consumption | 12 kWh/m³ | Wasit University, doi 10.31185/ejuow.vol11.iss1.433 |
Biological Polishing: Activated Sludge vs MBR for Foundry Streams
Biology is the polish, not the primary, in a foundry COD train. Even the 1995 foundry study, which achieved 97–99% phenol removal with the high-purity enzyme, still left residual organics in the supernatant that a downstream step had to address (Water Research 1995, ScienceDirect 0043135495002375). The decision in 2026 is usually between conventional activated sludge and a submerged MBR, and the trade-offs are well known: activated sludge is cheaper per cubic meter but has a larger footprint, shorter sludge age tolerance to shock phenolic loads, and higher effluent TSS. A submerged MBR delivers sub-micron effluent quality, tolerates a higher mixed liquor suspended solids concentration, and typically needs roughly 60% less footprint than a conventional system of equivalent capacity, which is often the deciding factor on a constrained foundry site. The toxicity risk is the same for both: residual phenols and heavy metals from the foundry stream will shock biomass unless equalization and an upstream Fenton or electrocoagulation stage are in place. The design inputs a buyer must collect before sizing either system are influent COD after the oxidation stage, the BOD/COD ratio, target effluent COD and TSS, peak versus average flow, and whether reuse water demands an additional RO or ultrafiltration polish. A MBR polishing stage for foundry wastewater is the option that also aligns with the anodizing wastewater COD removal engineering guide for sister metal-finishing facilities facing the same 2026 discharge envelope.
Technology Comparison and 2026 Decision Framework
The table below consolidates the five unit operations a foundry engineer is most likely to specify, with the two hard data points from the research woven in. The numbers in the cells are the supported values from the cited sources; the qualitative entries are the design constraints a buyer must verify against their own stream data.
| Technology | Target pollutant | Supporting data point | Key reagent or energy | Main limitation |
|---|---|---|---|---|
| DAF | Free oil, FOG, floatable grit | 4–300 m³/h skimming systems proven in metalworking pre-treatment | Polymer / coagulant dosing | Does not remove dissolved COD or phenols |
| Fenton oxidation | Dissolved COD, phenols, resin residues | Industrial •OH generation at acidic pH | H₂O₂ + Fe²⁺ catalyst | Residual H₂O₂ can raise apparent COD if overdosed |
| Electrocoagulation | Dissolved COD, emulsified oil | 99.5% COD, 94.2% oil at 12 kWh/m³ on 710 mg/L feed (Wasit, doi 10.31185/ejuow.vol11.iss1.433) | 12 kWh/m³ energy, Al/Fe electrodes, NaCl | Energy OPEX and Al/Fe hydroxide sludge volume |
| Horseradish peroxidase (enzyme) | Phenols | 97–99% phenol removal, 65% COD removal, 22-fold enzyme reduction with PEG (Water Research 1995, ScienceDirect 0043135495002375) | HRP enzyme + H₂O₂ + PEG additive | Enzyme cost not yet competitive at industrial scale |
| Activated sludge / MBR | Residual dissolved COD, BOD | MBR delivers <1 μm effluent, ~60% smaller footprint than conventional | Aeration energy, membrane replacement | Biomass shock from residual phenols and metals without upstream oxidation |
Three questions turn that table into a 2026 decision framework. First, is the stream high in free oil or FOG? If yes, DAF is the first unit, full stop. Second, is dissolved COD above roughly 1,500 mg/L, or is there a reuse target that the biological stage cannot hit alone? If yes, specify Fenton or electrocoagulation as the chemical step, with the choice driven by power cost and sludge handling capacity. Third, does the site need stable polishing for reuse, or is footprint the binding constraint? If yes, MBR; otherwise conventional activated sludge is acceptable. Sludge handling is the hidden cost driver in every chemistry train — Fenton produces iron hydroxide sludge, electrocoagulation produces Al/Fe hydroxide sludge — and a sludge dewatering filter press for the Fenton and electrocoagulation train must be in the budget from the first quote, not added after commissioning.
Frequently Asked Questions
What is the typical CAPEX range for a 50–200 m³/day foundry COD removal train in 2026?
No single number fits all foundry streams. Request a site-specific jar test on a 24-hour composite sample, supply the supplier with influent COD, BOD, FOG, TSS, phenol concentration, and peak flow, and ask for a DAF and polishing stage sized to those values rather than rely on a flat rate.
Can a foundry reuse the treated water for cooling or slag quenching in 2026?
Yes, provided the polishing stage meets the reuse specification. An MBR delivers sub-micron effluent quality, and adding RO or ultrafiltration downstream is standard where slag contact cooling demands low hardness and controlled chloride. Confirm the reuse envelope with the local utility before specifying the membrane train.
How do I know whether Fenton or electrocoagulation is the better fit for my stream?
Use the 12 kWh/m³ electrocoagulation benchmark from the Wasit 2 L cell as the OPEX reference, and the 97–99% phenol removal with 65% COD removal from the 1995 foundry study as the Fenton reference. Run both as jar tests on the same composite sample, and choose on the combination of power cost, sludge volume, and ease of residual peroxide control.
Will my 2026 discharge permit accept a chemistry-only train without a biological step?
Most regulators will not. The 1995 foundry study still left roughly 35% of the raw COD in solution at 99% phenol removal, which is why biological or membrane polishing is normally required downstream of the chemical or electrochemical stage. Confirm the local permit language before removing biology from the design.