What the Activated Sludge Process Diagram Shows
An activated sludge process diagram is the labeled schematic of a suspended-growth biological wastewater treatment system. Influent enters an aeration tank where microorganisms oxidize BOD under aerobic conditions, then flows to a secondary clarifier that settles the biomass. Settled sludge is recycled back to the aeration tank to maintain mixed liquor suspended solids, and a controlled fraction is wasted as waste activated sludge. Treated effluent proceeds to disinfection. The schematic typically marks streams Q, Qr and Qw, aeration tank volume V, influent and effluent substrate S0 and S, and biomass concentrations X0, XR, Xr and Xe — the same parameters used to model a complete-mix suspended growth process.
According to Lenntech, the activated sludge system is the BOD-removal stage that sits between the primary clarifier and disinfection in a municipal wastewater treatment train, and the diagram shows it as an aerobic suspended-growth process in which wastewater is aerated with oxygen in the aeration tank so that bacteria can grow, flocculate, and then be removed in a secondary clarifier.
CED Engineering traces the diagram's three essential elements back to Ardern and Lockett's original 1914 work in England: an aeration tank where the biology works, recycle of settled biological solids back to that tank, and wasting of excess sludge. Modern schematics still carry those three blocks even when they are folded into a package plant or an MBR — which is why reading the diagram is the first step before specifying equipment around it.
The main flow is influent → aeration tank → secondary clarifier → clarified effluent, with two return arrows: return activated sludge (RAS) from the clarifier underflow back to the head of the aeration tank, and waste activated sludge (WAS) leaving the clarifier underflow to sludge handling. Air supply enters the aeration tank, and the WAS line is the discharge point that eventually becomes a dewatering decision downstream.
How to Read the Streams and Symbols on the Schematic
Every symbol on an activated sludge schematic is a working variable, not a label. Lenntech publishes the parameter glossary that designers reuse on process flow diagrams, and the same notation appears in CED Engineering's worked examples, so a reader can move from a P&ID to a mass balance without re-defining variables.
| Symbol | Meaning | Units |
|---|---|---|
| Q | Influent flowrate | m³/d |
| Qw | Waste sludge flowrate | m³/d |
| Qr | Return line flowrate from clarifier | m³/d |
| V | Aeration tank volume | m³ |
| S0 | Influent soluble substrate (BOD or bsCOD) | g/m³ |
| S | Effluent soluble substrate (BOD or bsCOD) | g/m³ |
| X0 | Biomass concentration in influent | g VSS/m³ |
| XR | Biomass concentration in return line from clarifier | g VSS/m³ |
| Xr | Biomass concentration in sludge drain | g VSS/m³ |
| Xe | Biomass concentration in effluent | g VSS/m³ |
S0 and S bracket the biological load that the aeration tank must process; the X terms describe how biomass is partitioned between the recycle stream, the waste stream, and the clarified effluent. The X terms are what the designer actually controls by setting Qr and Qw — turn Qr up and MLSS in the tank rises; turn Qw up and sludge age falls.
Qr and Qw are drawn as two separate arrows on purpose. Qr is the recycle loop that controls mixed liquor suspended solids in the aeration tank, while Qw is the controlled bleed that controls solids retention time. Conflating them on the diagram is the most common schematic error: it hides the operating lever for SRT inside what looks like a single return line.
Two symbols drive operating cost and therefore deserve a callout on any drawing. The air/oxygen supply at the aeration tank sets aeration blower power, which is typically the largest electrical load in the plant. The sludge withdrawal line at the clarifier underflow sets the solids load on whatever dewatering device sits downstream — that is the Qw arrow a buyer will trace from the diagram to a filter press specification.
Four Common Activated Sludge Variations on the Same Diagram
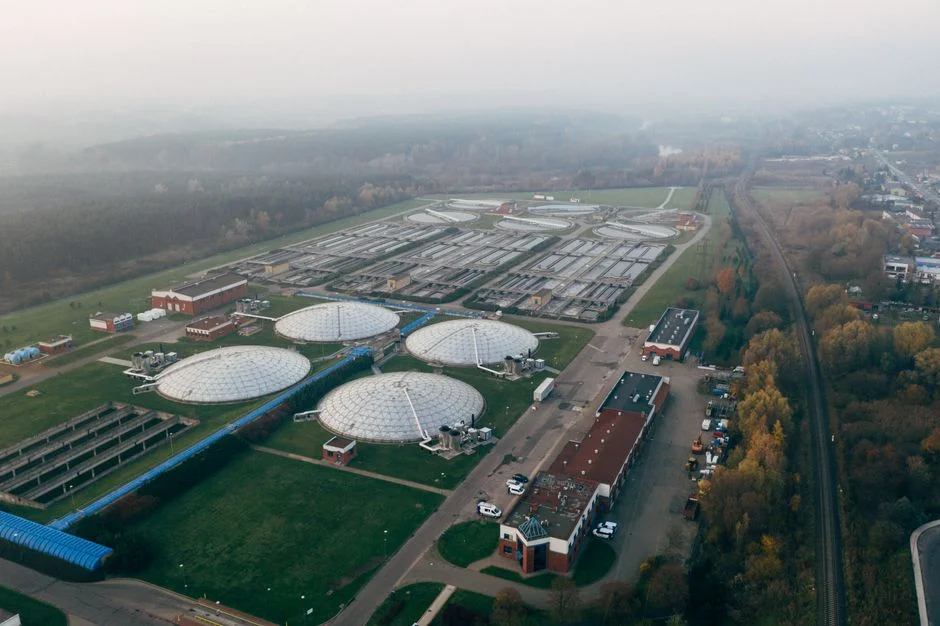
CED Engineering names four variants that share the same influent, aeration tank, secondary clarifier, recycle and wasting blocks but differ in tank geometry, HRT, and whether the recycle sludge is re-aerated. Putting them side by side is the fastest way to choose a configuration before drawing the P&ID.
| Variant | Tank geometry | Typical HRT | Primary clarifier | Distinctive feature |
|---|---|---|---|---|
| Conventional | Long, narrow — approximates plug flow | 6 to 8 hours | Yes | Standard flow pattern with plug-flow aeration tank |
| Extended aeration | Single larger tank | About 24 hours | Often eliminated | Minimal waste activated sludge; simpler operation |
| Completely mixed | Conventional flow pattern | Same as conventional | Yes | Influent and recycle dispersed uniformly to equalize shock loads |
| Contact stabilization | Short contact tank + separate re-aeration tank | 3 to 8 hours of re-aeration on the recycle sludge | Yes | Recycle sludge re-aerated in a separate stage before re-entering the contact tank |
The conventional variant uses a long, narrow aeration tank that approximates plug flow and is the default for the wide flow range CED Engineering describes for small to very large plants. Extended aeration raises HRT to about 24 hours, which lets the plant drop the primary clarifier and shrink the waste activated sludge stream to a periodic draw. Completely mixed keeps the conventional flow pattern but disperses influent and recycle uniformly through the tank so a slug load is diluted across the full mixed liquor volume. Contact stabilization splits the work — a short contact tank takes up the substrate, then the return sludge is piped to a separate re-aeration tank and held for 3 to 8 hours so the biomass digests what it sorbed before it is recycled to the contact tank.
Calculations the Diagram Enables: A Worked Sample
The schematic is not decorative. The same streams and symbols feed the recycle, wasting and F:M calculations a designer runs in CED Engineering's Example #6, which is worth reproducing because it ties every arrow on the diagram to a number.
Inputs: 3.5 MGD flow, primary effluent BOD 175 mg/L, primary effluent TSS 200 mg/L, recycle/waste SS 7,000 mg/L, aeration tank MLSS 2,000 mg/L, 75% volatile solids, intended SRT 12 days, tank volume 170,275 ft³. Converting volume to VMG: VMG = 170,275 × 7.48 / 1,000,000 = 1.27 million gallons.
Recycle rate, read off the Qr arrow: Qr = Qo (X − Xo)/(Xw − X) = 3.5(2,000 − 200)/(7,000 − 2,000) = 1.26 MGD. Waste activated sludge rate, read off the Qw arrow: Qw = (1/Xw)[(VMG · X / SRT) − Xe · Qe] = (1/7,000)[(1.27 × 2,000 / 12) − (20 × 3.5)] = 0.0203 MGD, or 20,300 gal/day. Aeration tank F:M, a property of the aeration tank rectangle itself: F:M = (So · Qo)/(%Vol · X · VMG) = (175 × 3.5)/(0.75 × 2,000 × 1.27) = 0.321 lb BOD/day per lb MLVSS. All three results come from CED Engineering's Example #6 worked solution.
The point of running the numbers is that the diagram now carries engineering meaning. Qr = 1.26 MGD tells the designer how big the recycle pump has to be; Qw = 20,300 gal/day tells the operator how much solids the downstream dewatering device has to handle; F:M = 0.321 places the plant in the conventional aeration range and validates the assumed 2,000 mg/L MLSS in the aeration tank block. If any of those values drift, the schematic is the place to find the lever that pulls them back.
A 2026 Microbiological Lens on the Schematic

The choice between drawing the aeration block as a single oxic stage or as an anoxic/oxic train now has published 2026 evidence behind it. The Frontiers in Bioengineering and Biotechnology study by Wang and colleagues (14:1912780, PMC13634615, 21 September 2026) sampled four full-scale petrochemical wastewater treatment plants in Northeast China — three oxic systems and one anoxic/oxic system — and combined 16S rRNA gene sequencing with iCAMP null-model analysis and PLS-PM path modeling.
Two qualitative findings from that study matter to anyone drawing the schematic. First, the oxic systems showed higher alpha diversity than the anoxic/oxic system, with the authors flagging that the comparison is potentially influenced by differences in influent composition and site-specific operational conditions. Second, iCAMP indicated a predominance of stochastic assembly in the oxic systems and deterministic assembly in the anoxic/oxic system; in the same paper, PLS-PM showed influent characteristics with stronger direct statistical associations with COD removal than process configuration, while process-related effects were represented mainly through indirect paths via microbial community composition.
For the schematic, that translates into a simple rule. The same labeled aeration tank can hide very different microbial communities depending on whether the box is drawn as a single oxic stage or as an anoxic/oxic train, so variant choice now carries an ecological justification on top of the HRT justification CED Engineering already documents. A buyer who is being asked to choose between a conventional oxic block and an A/O block should ask the vendor which assembly regime — stochastic or deterministic — the design assumes, and what the influent composition is at the specific site, because the Frontiers study shows those two factors jointly drive the community that does the work.
From Diagram to Equipment: What a Buyer Must Specify
The schematic is only useful if it is tied to the equipment a B2B reader will actually procure around the activated sludge block. The diagram's influent arrow first meets headworks screening, which protects the aeration tank and the secondary clarifier from rags, plastics and grit; a rotary mechanical bar screen for headworks screening is the upstream guard. Where the aeration tank and secondary clarifier are replaced or upgraded, an integrated MBR membrane bioreactor system combines the activated sludge stage with submerged PVDF membranes so the secondary clarifier and the downstream disinfection can be tightened into one packaged block. For packaged or below-grade service at residential, hotel, hospital or rural flows, the WSZ underground package sewage treatment plant delivers anoxic and aerobic contact oxidation in a buried unit, which is essentially the contact stabilization variant drawn as a skid.
The Qw arrow on the diagram eventually lands at sludge handling, and that is where the plate and frame filter press for sludge dewatering turns the waste activated sludge line into a manageable cake. MBR plants still need a downstream disinfection block, and the UV sterilizer for effluent disinfection covers chemical-free disinfection at the effluent end of the same schematic. For buyers comparing dewatering technologies side by side, the screw press energy efficiency in wastewater treatment guide and the compact sewage treatment unit vs alternatives comparison are the supporting reads, while the maintenance schedules to prevent sand and grit accumulation article covers the upstream failure mode that headworks screening is meant to prevent.
Translating the schematic into a procurement list, the buyer has to specify five equipment categories — headworks screening, the biological stage itself (aeration tank + clarifier, MBR, or package plant), sludge dewatering on the Qw line, effluent disinfection, and any blowers or diffusers sized to the aeration block. The Frontiers 2026 study adds a sixth, softer requirement: the buyer should request the influent characterization the design is based on, because influent composition had stronger direct statistical association with COD removal than process configuration in that study.
Frequently Asked Questions
What does each arrow on the activated sludge process diagram represent?
Per Lenntech, Q is the influent flowrate, Qr is the return line flowrate from the secondary clarifier back to the aeration tank, and Qw is the waste sludge flowrate leaving the clarifier underflow. V is the aeration tank volume, S0 and S are influent and effluent substrate concentrations, and X0, XR, Xr and Xe are biomass concentrations in the influent, return line, sludge drain and effluent respectively.
How do I choose between the conventional, extended aeration, completely mixed and contact stabilization variants?
Use CED Engineering's HRT and geometry rules: conventional uses a long, narrow plug-flow tank at 6 to 8 hours of HRT; extended aeration raises HRT to about 24 hours and often drops the primary clarifier; completely mixed keeps the conventional flow pattern but disperses influent and recycle to equalize shock loads; contact stabilization splits the work into a short contact tank plus a separate re-aeration tank that holds the recycle sludge for 3 to 8 hours.
What is the indicative capital cost of an activated sludge package plant and how do I budget for it?
The supplied research does not provide a published price for an activated sludge package plant, so a buyer must request a site-specific quotation tied to influent flowrate, influent BOD, target effluent quality and the chosen HRT. Ask the vendor to break the quotation into the five equipment categories in this article — headworks, biological stage, sludge dewatering, disinfection, and blowers — so the capex can be compared across variants on the same line items.
How do I verify that a proposed activated sludge design will meet discharge and compliance risk at my site?
Ask the vendor to demonstrate compliance against the schematic rather than against a generic data sheet. A defensible submittal should include the recycle, waste and F:M calculations in the same form as CED Engineering's Example #6, the influent characterization used as the design basis, the microbiological configuration of the aeration block (oxic versus anoxic/oxic) as discussed in the 2026 Frontiers study, and a maintenance plan for the headworks screening that prevents sand and grit accumulation on the upstream end of the same schematic.