Why Manufacturing Water Reduction Is Now a Production Metric
Water is no longer a line item buried in a utility bill — it is a per-unit production cost, a regulatory exposure and an ESG KPI that finance, operations and compliance all have to defend. A mid-sized US Midwest automotive plant circulates 20–30 million gallons per day; a semiconductor fab uses more than 100 million gallons per day; a beverage plant consumes 2–3 gallons of water for every gallon of product (S5, iFactory). At these volumes, the cost gap dominates the business case: fresh water runs $4.20 per 1,000 gallons, recycling costs $0.35–$0.40 per 1,000 gallons, and condensate capture runs about $0.05 per 1,000 gallons (S5) — so untreated discharge is, on a net basis, the most expensive option in the operating envelope.
Cooling systems typically account for 30–70% of total water consumption at most plants. A system circulating at 3 cycles of concentration can waste 60% of its makeup water compared with an optimized 7-cycle configuration, and a 5-cycle system still wastes 30% (S5). On the treatment side, 2026 electrocoagulation research published in MDPI's Water journal (2026-07-17) reports a 37% energy reduction through low-resistance graphene-oxide–phosphomolybdate composite cathodes and an asymmetric 1:10 electrode geometry — direct evidence that the OPEX of water-intensive treatment steps is no longer a fixed tax. For a board looking at the 2026 water-scarcity outlook for reuse in industrial and municipal sectors, that combination — cheaper reuse plus cheaper treatment — is what turns conservation from a sustainability talking point into a defensible production strategy.
Stage 1 — Build a Water Mass Balance Before Spending Capital
The most expensive mistake in a water program is retrofitting treatment equipment before measuring what actually flows where. The engineering work that protects capital is a three-step mass balance (S3, S4, S5):
- Sub-meter every major use. Install dedicated flow meters on cooling tower makeup, boiler feed, process rinse, cleaning, irrigation and any once-through heat exchanger. A single utility bill aggregates the data you need to act on, so it has to be disaggregated at the pipe level (S3, S4, S5).
- Sample quality at each point. Total dissolved solids, suspended solids, FOG, metals and temperature determine what a given stream can be reused for. Cooling-tower makeup tolerates a different profile than boiler feed or a parts-wash loop, so quality — not just volume — drives treatment selection (S4, Ion Exchange).
- Compute cost per production unit, per line and per shift. S5 documents a real blind spot: one production line consumed 8,000 gallons per unit while comparable equipment on the same site consumed 4,000 gallons per unit. Without unit-level tracking, the gap is invisible and unfixable (S5).
The deliverable is a one-page mass balance — freshwater in, recycled loops, evaporative loss, blowdown, discharge out — with a cost tag at every node. That single page is what converts "we should save water" into a ranked capital plan. A PLC-controlled chemical dosing system for cooling-tower chemistry is the kind of unit operation that earns its place only after the balance shows where chemistry actually moves the needle.
Stage 2 — Attack the Largest Consumers First
Sequencing matters: the biggest reductions come from the largest streams, ranked by share of plant water use and capital intensity.
Cooling towers. Raising cycles of concentration from a typical 3 to 7 by upgrading chemistry and bleed-off control is the single highest-leverage project at most sites. The S5 case study is concrete: an 18 million-gallon-per-day tower was cut to 10.8 MGD — a 40% reduction — by recirculating 40% of bleed through a secondary treatment loop, saving $158,400 per year on $82,000 of capex with a 6-month payback (S5).
Process rinse and wash water. Plating rinse, parts washing and equipment rinsing typically produce 5,000–50,000 gpd of water that already meets cooling-tower makeup or secondary wash quality. S5 reports plating rinse recycling at $0.35 per 1,000 gallons versus $4.20 per 1,000 gallons for fresh water; the same source puts parts-wash recycling at $0.40 per 1,000 gallons against $4.20 per 1,000 gallons fresh (S5).
Condensate and stormwater. HVAC and compressed-air condensate can be captured for roughly $0.05 per 1,000 gallons and reused for cooling-tower makeup, irrigation or wash water; stormwater retention is feasible for about $0.15 per 1,000 gallons after minimal treatment (S5).
Discharge-side polish. Pretreatment choice depends on influent loading and reuse destination. A dissolved air flotation system for FOG and suspended-solids removal handles the high-FOG, colloidal loads typical of food and metal-finishing streams; an MBR membrane bioreactor for reuse-quality polishing delivers sub-micron effluent suitable for RO feed or direct reuse in a smaller footprint than conventional activated sludge.
| Stream | Typical volume (S5) | Reuse destination | Recycle cost / 1,000 gal (S5) | Fresh-water cost / 1,000 gal (S5) |
|---|---|---|---|---|
| Cooling tower bleed (3 → 7 cycles) | Up to 40% of makeup water at 3 cycles | Recirculated through secondary treatment | Treatment-program upgrade only | $4.20 |
| Plating / metal-finishing rinse | 5,000–50,000 gpd | Cooling-tower makeup, secondary wash | $0.35 | $4.20 |
| Parts wash / line cleaning | 5,000–30,000 gpd | Secondary washing stages | $0.40 | $4.20 |
| HVAC / compressed-air condensate | 1,000–10,000 gpd | Cooling-tower makeup, irrigation, wash | $0.05 | $4.20 |
| Stormwater (roof / paved) | 0.5–5 M gal per event | Irrigation, dust control, process | $0.15 | $4.20 |
Stage 3 — Close the Loop with Treatment, Reuse and ZLD
Treatment-train selection follows the reuse destination, not the other way around. A defensible 2026 train stacks unit operations in this order: high-rate primary clarification → biological or physicochemical polishing → membrane recovery → ZLD polish where discharge is not permitted.
A lamella clarifier for high-rate primary clarification handles the high-volume pretreatment step, reducing chemical demand and footprint versus conventional basins. For streams with FOG or colloidal loads, a dissolved air flotation system removes the floatable fraction efficiently. Where the reuse target is boiler feed, rinse water or a closed process loop, an MBR membrane bioreactor delivers near-reuse effluent (typically <1 μm) in a footprint roughly 60% smaller than conventional activated sludge for the same loading, which matters when the plant is space-constrained. An industrial reverse osmosis system for high-recovery reuse then recovers up to 95% of permeate for boiler feed, rinsing or process water, with PLC-controlled continuous operation.
Zero liquid discharge is the right answer when the site is water-stressed, when the discharge permit is constrained, or when the contamination profile (high TDS, heavy metals, specific salts) makes dilution-plus-discharge uneconomic. ZLD combines RO, evaporation or crystallization, and condensate capture to eliminate liquid waste; capital intensity is in the multi-million-dollar range for semiconductor-scale operations, and site selection depends heavily on the regional water-scarcity and reuse context. For high-purity water applications, a 2026 equipment cost comparison for high-purity water treatment provides the per-unit-operation cost framing a CFO will expect alongside the engineering case.
Stage 4 — Make Savings Stick with Monitoring and Culture
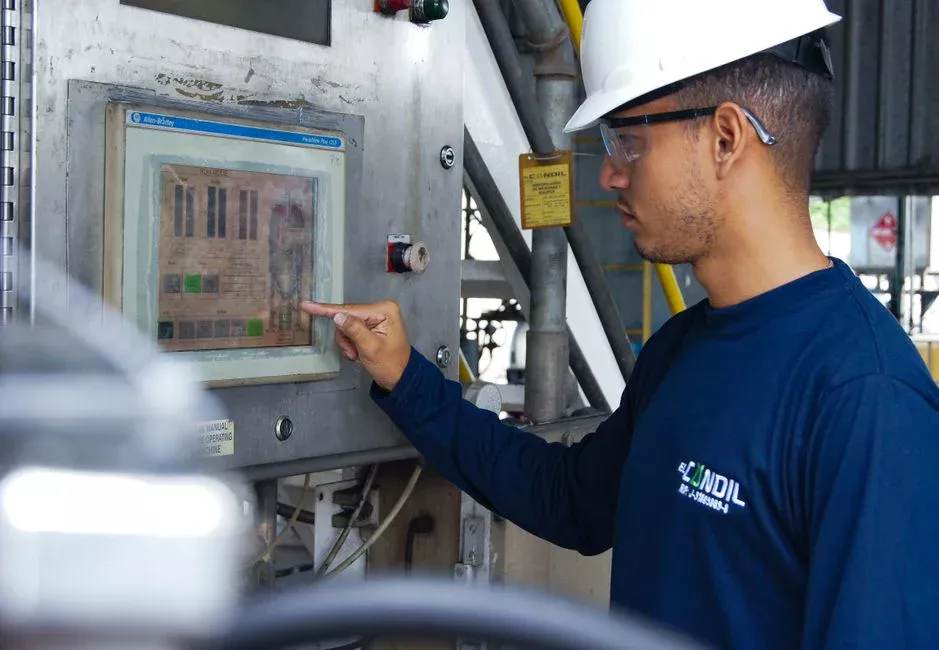
Hardware projects deliver one-time savings; software and culture convert those savings into a sustained 20–50% reduction. The mechanism is straightforward: track the right metric, alarm on drift, and give operators the authority to act.
The right metric is water cost per production unit, per line and per shift — the same lens that exposed the 8,000-versus-4,000 gallon-per-unit gap in the S5 case (S5). Smart monitoring with real-time flow, conductivity and quality sensors turns conservation into a closed-loop alarm when a target slips, rather than a quarterly surprise in a discharge report (S4, Ion Exchange). Lean scheduling of water-intensive steps flattens peak demand and reduces the buffer capacity the plant has to size for (S3, Mitidaption). Operator training and a written water-stewardship program are credited by S3 and S4 as a low-cost complement to hardware; without them, the next shift undoes the last project's gains. Practical implementation draws on standard water-treatment valves, media and instrumentation to keep sensors, control loops and chemical-feed points reliable.
A 12-24 Month Rollout That Actually Pays Back
Convert the framework into a sequenced plan finance can approve. The three tiers below are anchored to the impact, capex band and payback data published in S5; the 2026 electrocoagulation energy-reduction evidence (S1, MDPI, 2026-07-17) means OPEX savings on the treatment side continue even after raw-water use is minimized.
| Tier | Window | Capex band (S5) | Expected reduction (S5) | Expected annual savings (S5) | Payback (S5) |
|---|---|---|---|---|---|
| Tier 1 — Quick wins: condensate capture, sub-meters, cooling-tower bleed-off optimization | 0–3 months | <$10,000 | 5–10% | $5,000–$15,000 | Immediate |
| Tier 2 — Process recycling: process-water recycling, cooling-tower chemistry upgrade, water-quality monitoring | 3–12 months | $10,000–$40,000 | 15–30% | $15,000–$50,000 | 8–18 months |
| Tier 3 — Capital projects: cooling-tower retrofit, closed-loop washing, stormwater retention, ZLD polish | 12–24 months | $20,000–$100,000+ | 30–50% | $30,000–$100,000+ | 1–3 years |
Two details matter when this table meets a finance committee. First, the capex bands and savings ranges in S5 are facility-dependent; a buyer should request a site-specific water mass balance and quote before locking the budget. Second, the 37% treatment-side energy reduction reported in S1 (2026) is a research result, not a vendor guarantee — pilot validation on the specific matrix is required before it is booked into a multi-year OPEX forecast. The defensible business case stacks Tier 1 cash flow against Tier 2 capex and uses Tier 3 as a permit-and-growth enabler, not a standalone ROI bet.
Frequently Asked Questions
What does a realistic water-reduction project cost, and how is payback calculated?
S5 reports tiered ranges: Tier 1 quick wins under $10,000 with immediate payback and $5,000–$15,000 annual savings; Tier 2 process recycling at $10,000–$40,000 capex with 8–18 month payback and $15,000–$50,000 annual savings; Tier 3 capital projects at $20,000–$100,000+ with 1–3 year payback and $30,000–$100,000+ annual savings. The automotive cooling-tower case in S5 — $82,000 capex, $158,400 annual savings, 6-month payback — is the most concrete worked example in the public record. A buyer should request a site-specific mass balance and itemized quote rather than rely on these ranges for board-level commitments.
How should a buyer select a treatment-train supplier for a closed-loop program?
Selection should be driven by influent characterization and the reuse destination, not by equipment brand. A defensible shortlist evaluates each supplier on: (1) demonstrated flow and loading range on the specific stream (for example, DAF rated for the FOG and suspended-solids load observed in the audit), (2) reuse-quality effluent data on a comparable matrix, (3) PLC/SCADA integration with the plant's existing monitoring layer, and (4) reference installations with documented energy and water performance. The product data for the unit operations referenced in this article — DAF, MBR, RO, lamella clarifier, chemical dosing — should be requested with the same matrix-specific evidence the supplier would present to a process engineer in a P&ID review.
Which water streams should be sub-metered first in a manufacturing facility?
Sub-meter the largest-cost and largest-volume streams first: cooling-tower makeup, boiler feed, process rinse (plating or parts washing), cleaning operations, and any once-through heat-exchanger or scrubber loop (S3, S4, S5). For a plating facility specifically, the highest-value meters are on the rinse-water discharge line, because the S5 economics — $0.35 per 1,000 gallons to recycle versus $4.20 per 1,000 gallons for fresh water (S5) — make every thousand gallons of avoided fresh water immediately bankable. Landscaping and sanitary use are lower priority and can be metered in a later phase.
When does zero liquid discharge make sense for a manufacturing plant?
ZLD is the right answer when the site operates in a water-stressed basin, when the discharge permit is constrained or unpredictable, or when the contamination profile (high TDS, heavy metals, or specific salts) makes dilution-plus-discharge uneconomic at the volume being produced. S4 (Ion Exchange) describes ZLD as combining RO with evaporation or crystallization and condensate capture to eliminate liquid discharge; capital intensity is in the multi-million-dollar range for semiconductor-scale fabs, and the regional 2026 water-scarcity outlook is the right first filter for site selection. For a typical discrete-manufacturing plant, ZLD is a Tier 3 decision and should follow — not precede — Tier 1 and Tier 2 reductions that lower the volume ZLD has to handle.