How an MBR Plant Differs From Conventional Activated Sludge
A membrane bioreactor (MBR) replaces the secondary clarifier and tertiary media filter of a conventional activated sludge (CAS) plant with submerged membranes at a nominal pore size under 1 μm, producing a typical effluent turbidity below 1 NTU and cutting the overall footprint by roughly 60% compared to a CAS train of equal treatment capacity (per the HydropureWater integrated MBR system scope). The operator gains independent control of hydraulic retention time (HRT) and solids retention time (SRT), so MLSS can be held at 8,000–12,000 mg/L without the washout risk a clarifier imposes. The trade-off is real: membrane cleaning chemistry, TMP monitoring, relaxation/backwash cycles, and standby storage become new O&M cost lines that do not exist in CAS (Hazen & Sawyer S4 lists cleaning, storage, handling, calibration, and replacement as the new budget items MBR plants must plan for from day one).
Pretreatment and Upstream Guards That Protect the Membrane
Successful submerged MBR operation requires seamless performance of every unit process upstream of the membrane tank, because any upset there reaches the membrane (Hazen & Sawyer S4). The four guard processes and their typical 2026 design limits are: coarse screening with bar aperture at 3 mm or finer — coarser rags and fibres wrap and snap hollow fibres; grit removal rated to 200 μm — entrained grit abrades flat-sheet surfaces and erodes aeration diffusers; flow equalisation with at least 6 hours of retention — hydraulic peaks break MLSS floc and force transient high-TMP events; and primary clarification or DAF pre-skimming for FOG removal — oil and grease deposit on membrane surfaces and cause irreversible fouling that no chemical clean will fix. Together these guards handle the root causes of premature membrane failure, which field data attributes to upstream upsets in roughly 80% of cases (HydropureWater field data, 2026). Operators should verify screening performance with GX Series rotary mechanical bar screens rated to 3 mm aperture before commissioning.
Startup and Commissioning Sequence
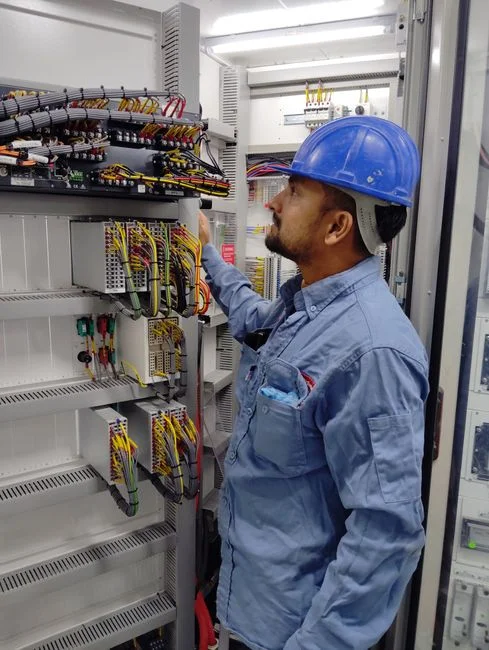
The first 30 days decide whether the membranes will reach their 8–10 year design life or fail early; S4 calls out initial startup and commissioning as a strategy category where early decisions drive long-term life. Walk this sequence in order:
- Leak and integrity test. Pressure-test all air and permeate manifolds. Integrity-test every module at 30–50 kPa using an air-hold decay test before seeding — log the starting baseline (typically 5–15 kPa clean).
- Seed and ramp MLSS. Fill with return activated sludge to 4,000–6,000 mg/L. Ramp to the 8,000–12,000 mg/L operating target over 7–14 days to avoid shock loading a fresh biomass.
- Bring aeration online. Confirm dissolved oxygen at 1.5–2.5 mg/L in the membrane tank and verify scour air flow at 0.3–0.5 m³/h per m² of membrane area.
- Run reduced flux. Operate permeate at 50–70% of design flux (roughly 8–15 LMH) for the first 7 days while biomass acclimates and EPS production stabilises.
- Build the permeability baseline. Log TMP per module daily and chart flux/TMP per module — this baseline is the reference against which every future clean is judged.
Normal Operation: The Parameters You Watch Every Shift
Every shift, the operator reads and records the same six to eight numbers. Submerged MBRs deliver consistent low-turbidity effluent if proper operation and maintenance practices are followed (Hazen & Sawyer S4); the corollary is that any deviation from these targets must be investigated within the shift, not the next day.
| Parameter | Operating target | Alarm | Stop / clean trigger |
|---|---|---|---|
| MLSS (membrane tank) | 8,000–12,000 mg/L | >13,000 mg/L | >15,000 mg/L — wasting required |
| DO (membrane tank) | 1.5–2.5 mg/L | <1.0 mg/L | <0.5 mg/L for 30 min |
| Flux | 15–25 LMH | >28 LMH | Reduce or recovery clean |
| TMP | 5–30 kPa | 30–40 kPa | ≥50 kPa — clean immediately |
| F/M ratio | 0.05–0.15 kg BOD/kg MLSS·d | <0.04 or >0.20 | Adjust wasting / feed |
| SRT | 15–30 days | <10 d or >40 d | Reset wasting rate |
| Scour air rate | 0.3–0.5 m³/h per m² | <0.25 m³/h per m² | Diffuser inspection |
| Permeate turbidity | <1 NTU | >1 NTU | >2 NTU — integrity test |
Standard relaxation runs 8–10 minutes off per 60 minutes on, and a backwash (permeate plus optional 200–500 ppm NaOCl) every 24–48 hours is typical. MLSS, TMP, and DO drift in the same direction before effluent quality breaks, so the operator who trends all three catches the upset before the regulator does. For module-level monitoring points, see the DF Series flat-sheet MBR modules specification for typical clean-water permeability baselines per cassette.
Routine Maintenance Schedule and Operator Checklist
Turn the parameter targets into a calendar the maintenance team can plan against:
- Daily: Log TMP, flux, MLSS, DO, scour air flow, and permeate turbidity per module; check blower oil and valve positions; confirm CIP chemical stock (NaOCl 12–15% and citric acid).
- Weekly: Trend permeability (flux/TMP) per module and compare against the baseline chart; inspect aeration piping for blockages; verify online instrument calibration against the lab meter.
- Monthly: Visual inspection of the membrane tank for foaming, scum, and dead zones; sample mixed liquor SVI and flag bulking if SVI exceeds 150 mL/g; dose antifoam sparingly if needed.
- Quarterly: Review cleaning-chemical consumption against the OPEX budget; pull one module for visual inspection if TMP has climbed despite cleans.
- Annually: Replace scour air diffusers as required; run a full integrity test (air-hold decay <0.5 kPa/min per module); reconcile membrane age against the replacement reserve.
Spare water treatment valves, seals, and media should be held on the shelf so a single failed component does not take a membrane train offline.
Membrane Cleaning: Recovery Clean, CIP, and When to Use What
Biofouling is the dominant MBR fouling mode, and the operator's job is to remove the fouling layer before it compacts into something chemistry cannot touch. Two clean tiers cover 95% of routine work.
| Clean type | Frequency | Chemical | Dose | Soak time | Target foulant |
|---|---|---|---|---|---|
| Recovery (in-place) | Every 1–3 months | NaOCl | 1,000–3,000 ppm | 2–6 h | Biofilm, EPS, organics |
| CIP / maintenance wash | Every 6–12 months | NaOCl then citric acid | 1,000–3,000 ppm NaOCl; 1–2% citric at pH 2.0–3.0 | 4–8 h each step | Organics then inorganic scale |
Decision rule: if TMP returns to within 10% of the clean-water baseline after a NaOCl recovery clean, defer CIP; if it does not, schedule CIP within two weeks. The order is alkaline first, acid second — never mix NaOCl and acid in the same tank, because hypochlorite generates chlorine gas below pH 5. For replacement membranes and CIP piping, source through the HydropureWater membrane elements and replacement parts catalogue so materials of construction match the original modules.
Standby, Storage, and Membrane Replacement
Neglect during shutdown causes more irreversible damage than neglect during operation, and S4 explicitly lists membrane storage and handling as a significant O&M budget item.
- Short standby (under 48 h): Keep membranes submerged in permeate and keep the scour blower on low; do not drain.
- Long standby (over 48 h): Fill the membrane tank with 500–1,000 ppm NaOCl storage solution and re-circulate through the modules; refresh every 30 days and verify pH stays above 9.
- Wet storage of spare modules: Keep hydrated with permeate or 100–200 ppm NaOCl in a covered tank; never let PVDF dry out, because dried membranes lose permeability permanently.
- Replacement trigger: Irreversible fouling where CIP no longer restores TMP to within 20% of baseline, or any module failing an integrity test (air-hold decay above 0.5 kPa/min).
Operators should plan the replacement reserve budget from day one — the 8–10 year design life is achievable, but only if a damaged module is replaced within the quarter, not deferred until cascade failure.
Hollow-Fibre vs Flat-Sheet MBR: Maintenance Trade-offs
Both configurations can meet <1 NTU effluent and comparable COD/BOD removal when operated to the parameter table above, but the maintenance profiles differ in ways that affect labour planning and spare-parts holding.
| Item | Hollow-fibre | Flat-sheet (DF Series) |
|---|---|---|
| Backwash capability | Yes — in-situ permeate + optional NaOCl | No — chemical soak only |
| Packing density | High (around 2× flat-sheet) | Lower footprint gain vs CAS |
| Cleaning labour | Fully in-situ, no element handling | Element removal and reinstallation — roughly 15–25% more labour hours per clean |
| Failure mode | Single fibre break, localised and detectable by air-hold test | Seal or frame failure; whole element replaced |
| Cross-flow energy | Scour air only | Scour air only — 10–20× lower energy than external cross-flow (per DF Series specification) |
| Spare holding | Module-level spares | Element-level spares, lower unit cost |
Specifying DF Series flat-sheet MBR modules suits sites where labour for module handling is available and where chemical-soak cleaning fits the maintenance window; hollow-fibre suits sites that want in-situ backwash and higher packing density.
MBR O&M Cost Breakdown for 2026
Give the plant manager a defensible OPEX model — not a vague "it depends."
| Cost line | Share of annual MBR OPEX | 2026 driver |
|---|---|---|
| Energy (blowers + recirculation) | 35–45% | Aeration is the largest line; DO control directly drives OPEX |
| Chemical cleaning (NaOCl, citric acid, antifoam) | 10–15% | NaOCl price pressure in 2026 makes CIP discipline financially meaningful |
| Membrane replacement reserve (amortised) | 20–30% | 8–10 year PVDF design life when the O&M programme is followed |
| Labour | 15–25% | Trained 2-person shift team plus scheduled maintenance days |
A structured O&M programme typically cuts total MBR OPEX by 10–20% versus run-to-failure operation, with most of the saving coming from membrane-life extension and avoided emergency CIPs (HydropureWater field data, 2026).
Troubleshooting Decision Tree
When the alarm sounds at 2 AM, walk the tree in order — do not jump to chemistry before the basics.
- Sudden TMP rise. Step 1: confirm scour air flow and recent flux history. Step 2: verify MLSS has not exceeded 13,000 mg/L. Step 3: trigger a NaOCl recovery clean. Step 4: if TMP does not recover within 24 h, schedule CIP within the next 2 weeks.
- Foaming in the membrane tank. Per S4 lessons learned, common causes are young or old sludge and surfactant ingress — step down MLSS by increasing wasting, check upstream FOG, and dose antifoam sparingly; address root cause rather than masking with defoamer.
- Low DO in the membrane tank. Check blower output, scour diffuser condition, and MLSS — high MLSS raises oxygen demand beyond the design envelope.
- Turbidity breakthrough (effluent >1 NTU). Almost always a broken fibre or compromised seal — run an integrity test on each module, isolate the failed unit, and replace.
- Rapid MLSS drop. Check for toxic ingress upstream or hydraulic overload washing out the clarifier equivalent; reseed if MLSS falls below 5,000 mg/L to protect nitrification and SRT.
Frequently Asked Questions
What MLSS should an MBR be operated at in 2026?
Hold MLSS in the membrane tank at 8,000–12,000 mg/L for most municipal and light-industrial duties; trigger a wasting step above 13,000 mg/L and reseed if MLSS drops below 5,000 mg/L. The SRT window that supports this range is 15–30 days at a flux of 15–25 LMH.
How often should a recovery clean be performed on a submerged MBR?
Every 1–3 months with 1,000–3,000 ppm NaOCl for 2–6 hours, triggered by a rising TMP trend rather than the calendar alone. If TMP fails to return to within 10% of clean baseline after the NaOCl soak, schedule a full CIP with citric acid within 2 weeks.
What TMP should trigger an emergency MBR shut down?
Operating TMP should sit between 5–30 kPa; the alarm threshold is 30–40 kPa and the clean-now threshold is 50 kPa. Continuing to run above 50 kPa risks irreversible fouling that no chemical clean can reverse.
How do you store spare MBR membranes long term?
Keep them wet at all times in permeate or 100–200 ppm NaOCl solution, covered, at pH above 9, and refresh the storage solution every 30 days. PVDF that dries out loses permeability permanently and the module must be replaced.
Is hollow-fibre or flat-sheet MBR easier to maintain?
Hollow-fibre modules tolerate in-situ backwash and chemical soak without element handling, which lowers labour per clean by roughly 15–25% relative to flat-sheet configurations; flat-sheet modules trade that labour cost for individual element replaceability and 10–20× lower cross-flow energy per the DF Series specification.