
Where the Energy Goes in a Nanofiltration System
Specific energy consumption for a nanofiltration train typically lands between 0.5 and 1.5 kWh per cubic metre of permeate, with the high-pressure feed pump responsible for 70–85% of that total. The reason is straightforward: NF membranes rated at 200–800 Dalton MWCO reject multivalent ions and organics at 7–10 bar feed pressure, while reverse osmosis typically operates at 10–30 bar and seawater RO pushes 55–85 bar (per Patsnap Eureka 2025-10). That pressure gap is the single largest lever in any NF energy reduction plan.
Secondary loads matter once you start cutting the pump: feed booster pumps draw another 5–10% of train energy, backwash pumps and CIP skids add 3–7%, chemical dosing and instrumentation air combined run 2–5%. On a 1,000 m³/d NF plant, an unbudgeted 0.2 kWh/m³ in auxiliaries is roughly €15,000–20,000 per year in wasted electricity at 2026 European industrial tariffs. Track specific energy consumption (SEC, kWh/m³ permeate) as the single metric for the rest of this article; SEC normalises everything from pump rewinds to membrane replacement against the actual product water you sold to the process.
Hybrid systems pairing NF with renewable power and energy recovery have demonstrated 2.5–4.0 kWh/m³ reductions versus conventional trains (per Patsnap Eureka 2025-10). That is the ceiling you are designing toward.
Operating Pressure and Flux: The Two Levers You Control
Pump work scales linearly with the pressure differential across the membrane stack (W = ΔP × Q), so cutting feed pressure from 15 bar to 8 bar roughly halves the dominant term in your SEC. The catch is throughput: lower pressure means lower flux, and the only way to keep permeate flow constant is to add membrane area, add a second pass, or fix whatever is choking the membrane in the first place. Most NF plants are not flux-limited by membrane capability — they are flux-limited by fouling.
This is where pretreatment pays for itself. A well-sized UF pretreatment skid ahead of the NF array drops the silt density index below 3 and removes the colloidal and biological fraction that compresses flux. With clean feed, you can run the same NF vessel at 9 bar instead of 14 bar and still hit design flux, which translates directly into a 35–40% cut in pump kWh/m³. The economics of pretreatment are covered in detail in the fifth section below.
Membrane selectivity is the other pressure driver. Tight NF at 200–300 Dalton MWCO delivers high divalent ion and organic rejection but typically requires 12–18 bar to maintain design flux. Loose NF at 300–800 Dalton MWCO runs at 7–10 bar with moderate hardness and organics rejection, trading selectivity for SEC. For textile dye + salt recovery, loose NF lets monovalent salt pass while retaining the dye molecule, which means downstream RO polish on a much smaller brine volume — a configuration that has been documented at 30–60% lower energy than RO-only separation (per ACS Environ. Sci. Technol. 2022 study on quercetin-based NF for textile recycling).
Temperature compounds every other lever. Feed water viscosity rises about 2.5% per °C of cooling, so a winter feed at 8°C versus a summer feed at 22°C increases the pump work needed to maintain flux by roughly 12–18% on the same membrane. Temperate-climate plants see this delta between January and July; tropical plants do not, which is one reason NF energy audits in northern Europe consistently look worse than equivalent audits in Southeast Asia.
NF, RO, and Hybrid NF+RO: An Energy Comparison
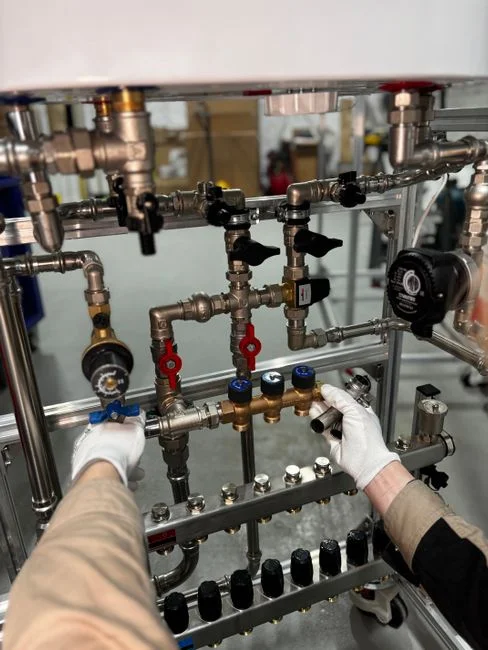
The fastest way to defend a process change internally is to put a head-to-head table in front of management. The numbers below are typical operating envelopes for industrial NF and RO trains at 70–85% recovery on feedwater of 2,000–5,000 ppm TDS. Your plant's duty may push outside this envelope, but the ranking holds: lower-pressure membrane processes always win on kWh/m³ when rejection requirements allow.
| Membrane process | Feed pressure (bar) | SEC (kWh/m³ permeate) | Recovery (%) | Target rejection | Typical duty |
|---|---|---|---|---|---|
| Low-pressure NF (loose, 300–800 Da) | 7–10 | 0.4–0.8 | 80–90 | Divalent ions, organics >300 Da, partial hardness | Textile dye recovery, water softening, partial desalination |
| Standard NF (tight, 200–300 Da) | 10–20 | 0.8–1.5 | 70–85 | Multivalent salts, colour, TOC, pesticides | Surface water polishing, food & beverage concentration |
| Brackish RO (BWRO) | 10–15 | 0.7–1.2 (with ERD) | 70–85 | TDS, monovalent ions, all organics | Process water make-up, boiler feed |
| Seawater RO (SWRO) | 55–85 | 3.0–6.0 (with ERD) | 40–60 | Dissolved salts, boron | Coastal intake, high-recovery ZLD |
Two patterns jump out. First, NF can match BWRO on energy when paired with a downstream RO polish step that only has to handle the brine fraction, not the full feed. Second, hybrid NF+RO is the highest-leverage configuration for any plant with both a fouling organics problem and a dissolved-solids target — which is most textile, food & beverage, and semiconductor duties. The NF takes out the organics, hardness, and suspended matter that would otherwise force the RO to run at higher pressure and CIP more often; the RO then polishes a smaller, cleaner stream. Total train SEC typically lands 30–60% below an RO-only configuration on the same feed (per ACS 2022; confirmed against the MBR+NF benchmark in MBR vs NF energy comparison data). For applications where the feed is already low in organics and the rejection target is straightforward, a single-pass industrial RO system remains the simpler specification.
Energy Recovery Devices and Smart Pumping
Energy recovery devices capture hydraulic energy from the concentrate stream and transfer it back to the feed. Isobaric ERDs — pressure exchangers (PX) and turbochargers — return 90–95% of the pressure energy in the brine, while centrifugal ERDs (work exchangers, hydraulic turbochargers) return 60–80%. In RO service, an ERD typically cuts pump energy 30–60% (industry conservative range); in NF-only trains, the concentrate is at lower pressure so the absolute gain is smaller but still meaningful on large flows. A 500 m³/d NF plant at 10 bar recovering 85% has roughly 75 m³/d of concentrate at 9 bar — about 18–20 kW of recoverable hydraulic energy, worth €12,000–18,000 per year at 2026 industrial tariffs.
VFD-driven high-pressure pumps are the lowest-cost first step on any retrofit. The control logic is simple: track permeate flow and transmembrane pressure, modulate pump speed to hold the lowest pressure that still meets design flux. Most plants running constant-speed pumps are over-pressurised by 2–4 bar to mask fouling — a VFD exposes the waste and lets operations fix the underlying problem instead of throwing pump kWh at it. Payback is typically 6–14 months on the VFD alone, before the ERD or pretreatment retrofit.
Staging matters in multi-vessel NF arrays. A single-vessel train runs the whole feed across one pressure drop; a two-stage array with inter-stage boosting lets the first stage run at lower pressure (where it does the bulk rejection work) and the second stage at slightly higher pressure (where it polishes). The energy penalty of the inter-stage booster is small compared to the energy saved by running 80% of the membrane area at lower ΔP. For a paired industrial RO system downstream, the same logic applies to inter-stage boosting between RO passes.
Pretreatment and Membrane Care That Pay You Back in kWh
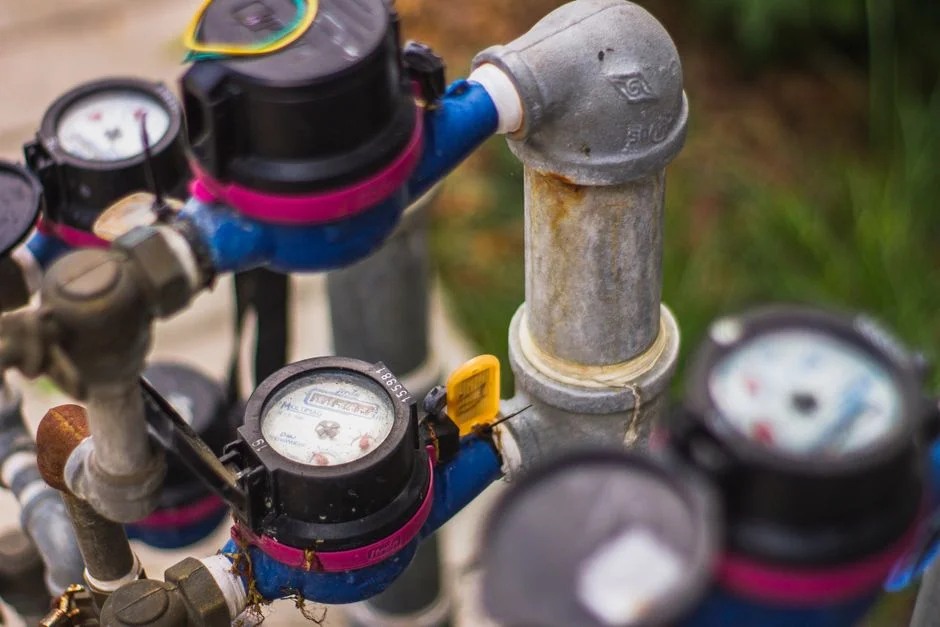
Most NF SEC overshoots are not pump problems — they are fouling problems wearing a pump-cost disguise. A UF pretreatment skid at 0.03 µm (PVDF, outside-in or inside-out) typically drops the silt density index from 5–8 down to 1–2, which holds NF flux stable within ±10% over a 12-month run instead of declining 30–40% as colloidal fouling compresses the membrane. Stable flux means you can set pump pressure once and leave it, instead of trimming ΔP upward every month to hold permeate flow. On a 1,000 m³/d plant, that flux stability alone is worth 0.2–0.4 kWh/m³.
Chemical dosing is the second pretreatment lever. Automatic antiscalant dosing proportional to feed flow and recovery ratio lets you push recovery from 75% to 85% without scaling-induced flux loss, which in turn cuts the volume of concentrate you have to handle downstream. Antiscalant cost is typically €0.02–0.05 per cubic metre of permeate — an order of magnitude smaller than the pump-energy cost of a scaled membrane running at 18 bar instead of 12 bar. Biological fouling control via ozone-based biofouling control or on-site ClO₂ avoids the membrane-degradation problem of continuous free-chlorine dosing while still keeping the feed biologically stable.
Automated CIP and backwash sequences extend membrane life by up to 40% in high-fouling renewable-energy wastewater duty (per Alfa Laval case referenced in Patsnap Eureka 2025-10). For a plant operator, that 40% life extension defers roughly €80,000–150,000 in membrane replacement CapEx on a mid-sized NF array and holds flux at nameplate for longer, which keeps SEC at design value. A useful anaerobic digester energy reduction strategy shares the same logic — stable biology, stable output, lower per-unit energy.
5-Step Plan to Cut NF Energy Use in 2026
Use this as a quarterly review checklist. The five steps map directly to the levers above and produce a defensible CapEx case with measured kWh/m³ before and after.
- Baseline SEC. Install a kWh meter on the high-pressure pump feed and a flow meter on the permeate line. Compute weekly SEC = pump kWh ÷ permeate m³. Compare against the 0.5–1.5 kWh/m³ envelope in section one. Anything above 1.5 kWh/m³ on a standard NF duty is a retrofit candidate.
- Audit pressure and flux. Plot feed pressure, permeate flow, and dP trend over the last 12 months. A rising pressure at constant flow is fouling; a falling flow at constant pressure is the same fouling wearing a different hat. Identify whether over-pressurisation is masking the underlying flux loss before you spend on a VFD.
- Add or upgrade pretreatment. If SDI is above 3, install a UF pretreatment skid sized for 110–120% of design flow. If recovery is being throttled by scaling, deploy automatic antiscalant dosing tied to flow and conductivity. Both are Opex-positive through SEC reduction, not just CapEx.
- Install VFD and evaluate ERD. VFD on the feed pump is the first hardware change. If RO polishing is downstream, evaluate an isobaric ERD on the RO concentrate — payback is typically 1–3 years on RO service, longer on NF-only. Use NF system valves, pressure gauges, and replacement media sized for the lower operating pressure once the VFD is in place.
- Track weekly KPIs. Dashboard: SEC (kWh/m³), normalised flux (LMH/bar), dP trend (bar/month), CIP frequency (events/quarter), and concentrate flow (% of feed). If SEC drifts more than 10% from baseline in any month, trigger an audit before the drift compounds. For semiconductor duty, the integrated NF+RO train feeds the ZLD loop discussed in semiconductor ZLD with NF and RO breakdowns.
Expected outcome on a typical industrial NF retrofit: 20–35% SEC reduction in year one from VFD and pretreatment alone, 40–55% once ERD and staging optimisation are added, full payback on the combined CapEx in 18–30 months at 2026 European industrial electricity tariffs. The numbers are not magic — they are the same engineering arithmetic that powers every NF-vs-RO trade study on the planet, applied with measurement rather than assumption.
Frequently Asked Questions
How much energy does a nanofiltration system use?
Standard industrial NF operates at 7–20 bar feed pressure with specific energy consumption of 0.5–1.5 kWh per cubic metre of permeate. Low-pressure loose NF (7–10 bar) sits at the low end of that range; tight NF (15–20 bar) sits at the top. For comparison, seawater RO consumes 3.0–6.0 kWh/m³ at 55–85 bar.
Can nanofiltration replace RO for energy savings?
For partial desalination, dye and organics removal, and water softening, NF can replace RO outright and save 50–70% of the SEC. For full monovalent-ion rejection you still need RO downstream, but pairing NF ahead of RO cuts the RO's energy use by 30–60% because the NF removes the fouling organics that would otherwise force the RO to run at higher pressure and CIP more often.
What is the payback on an energy recovery device?
On RO concentrate at 10–15 bar, an isobaric ERD typically pays back in 1–3 years at 2026 industrial electricity tariffs, returning 30–60% of pump energy depending on recovery and pressure. On NF-only concentrate at 7–10 bar, the absolute kWh recovery is smaller and payback extends to 2–5 years; a VFD on the feed pump is usually the better first investment on NF-only trains.
How does pretreatment affect NF energy?
UF pretreatment stabilises NF flux by removing colloidal and biological foulants, which lets you lower feed pressure by 2–5 bar at the same throughput. That typically cuts SEC by 0.2–0.4 kWh/m³ and extends membrane life by up to 40% (per Alfa Laval case in Patsnap Eureka 2025-10), deferring €80,000–150,000 in replacement membranes on a mid-sized array.
Is NF energy use lower than MBR?
On a per-cubic-metre basis, NF alone uses 0.5–1.5 kWh/m³ versus 0.3–0.8 kWh/m³ for a well-operated MBR, so a standalone MBR can be cheaper to run. The MBR+NF hybrid changes the comparison: combining MBR biological treatment with NF polishing achieves 98% organic removal at roughly 30% lower energy than conventional biological + tertiary treatment trains (per Patsnap Eureka 2025-10), because the NF step replaces energy-intensive tertiary polishing and the MBR effluent is already low in solids.