Why Riviera Beach Pretreatment Limits Are Stricter Than the National Baseline
Local industrial discharge limits in the Riviera Beach service area are not arbitrary — they are an engineered response to documented hydrogeology. USGS Water-Resources Investigations Report 77-47 establishes that the shallow aquifer supplying the region ranges from approximately 300 feet thick at the Lake Worth coastline to less than 175 feet inland, with municipal supply wells drawing over 5 MGD from a zone sitting almost 1 mile from the saltwater source. The same report documents that seawater has already advanced inland under combined stresses: increased pumpage, reduced recharge from land development, and below-normal rainfall. The C-17 Canal corridor adds a second pressure: dissolved solids exceeding 500 mg/L, which the local POTW treats as the threshold for tightening industrial discharge limits. FDEP layers a nutrient-removal expectation on top of this, anchored to Everglades and coastal protection, which is why a comparable bottling or dairy plant in Arizona or Colorado will not see the same FOG, TN, or TP numbers on its discharge permit. The defensible internal message is simple: every pound of BOD, FOG, ammonia, and phosphorus a Riviera Beach F&B plant sends down the sewer is a pound that the receiving utility must either remove at the central plant or risk pushing further into an aquifer that is already brackish at the coast.
The Compliance Stack: 40 CFR Part 403, FDEP, and Your Local POTW
Three regulators share authority over an F&B discharger in the Riviera Beach area, and the engineer designing the pretreatment system has to satisfy the tightest applicable number, not the most lenient. At the federal tier, 40 CFR Part 403 establishes the General Pretreatment Regulations, and the categorical pretreatment standard in 40 CFR Parts 405–471 sets subcategory-specific effluent limits tied to the plant's SIC/NAICS code; identifying the correct subcategory is the first deliverable, not an afterthought. FDEP operates as Florida's NPDES authority and applies heightened expectations for TKN, ammonia, total nitrogen, and total phosphorus reduction because of the Everglades and coastal aquifer context, which is reflected in any industrial user permit the agency reviews. The local POTW acts as the Control Authority and is the regulator the operator actually reports to; the POTW runs a Technically Based Local Limits (TBLL) analysis that can impose FOG caps, instantaneous maximum limits, and a formal slug-load control plan on top of the federal and state floors. The compliance file has to contain a baseline monitoring report (BMR) within 180 days of discharge for a new categorical user, a 90-day compliance report, periodic self-monitoring records, the slug control plan, and the annual report — missing any one of these is what triggers a notice of violation in this region, not a single exceedance alone.
What F&B Wastewater Actually Looks Like in Riviera Beach
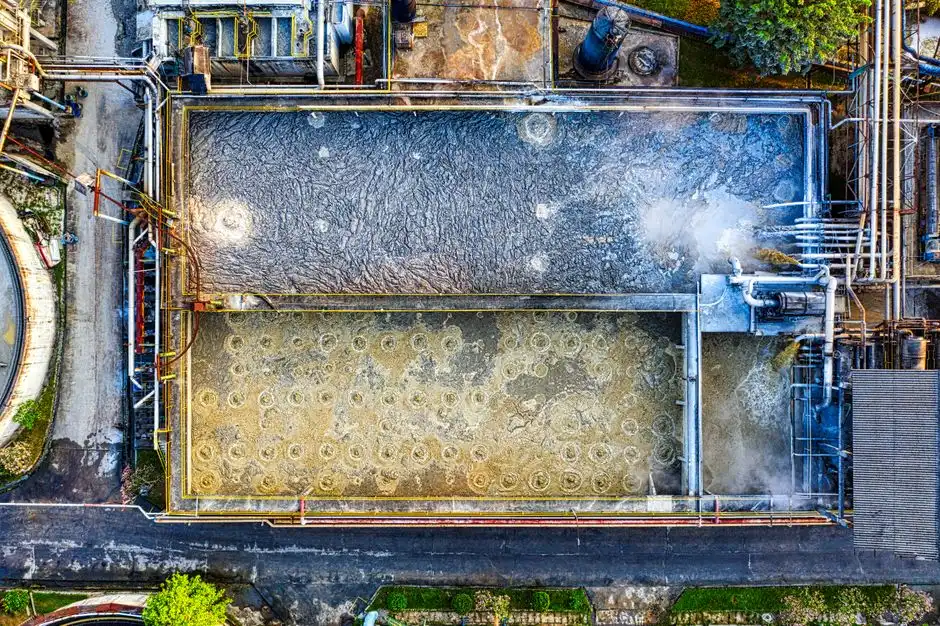
F&B wastewater in this corridor is not a single stream — it is four streams that arrive at the headworks out of phase. The pH swings from 3 to 11 between CIP chemical dumps and product washdown. BOD₅ routinely runs 800–10,000 mg/L, TSS 200–5,000 mg/L, and FOG 100–3,000 mg/L depending on whether the line is bottling, dairy, sauce/pickle, or brewery. The four problem streams engineers most often see on the Riviera Beach rail-and-port corridor are: CIP chemicals (caustic and acid rinses with high pH swings and high conductivity), high-strength batch discharges (run tanks, line flushes, fermentation bottoms), washdown solids (rinds, packaging fragments, fruit pulp), and oil or grease from cooking or rendering steps. Conventional wastewater treatment methods built around steady-state biology struggle with this influent because the FOG fraction floats, the organic load pulses, and the pH wanders — a fixed-parameter activated-sludge tank will either starve or be overloaded on any given shift. That variability is the engineering justification for the unit operations that follow.
A Defensible 2026 Pretreatment Train for F&B Near Riviera Beach
The process train below is the configuration an environmental engineer can present to both the regulator and the procurement team in the same meeting. Each step addresses one of the four problem streams from the prior section, and the operating parameters are sized to the categorical and local limits in the next section.
- Headworks screening. A rotary mechanical bar screen at 2–6 mm opening removes rags, plastics, and large solids before they reach the pumps or the membranes downstream. This is cheap insurance against MBR fouling and DAF skimmer jams.
- DAF for FOG and TSS. A DAF system for FOG and suspended solids removal is the FOG workhorse, expected to deliver 60–90% FOG removal and 70–90% TSS removal at 4–300 m³/h throughput depending on the skid size. Skimmings route to sludge dewatering; underflow solids join the waste activated sludge stream.
- Equalization with chemical dosing. An 8–24 hour equalization basin with automatic chemical dosing for pH and coagulant control absorbs batch and CIP slugs, neutralizes pH, and balances nutrient ratios ahead of the biological stage. Without EQ, no biological step downstream will hold a steady effluent.
- Biological treatment. Either BNR (A²/O or MBBR) for nutrient-focused compliance or an integrated MBR system when footprint is tight, FOG variability is high, or the plant is targeting water reuse. MBR effluent filters to <1 μm with a typical MLSS of 8,000–12,000 mg/L versus 2,000–4,000 mg/L in conventional activated sludge.
- Disinfection. A chlorine dioxide generator for disinfection or UV system, selected against the receiving sewer's residual chlorine cap. UV is favored when chlorination byproducts or salinity are concerns; ClO₂ is favored when a residual is required for the downstream force main.
- Sludge handling. A plate and frame filter press for DAF skimmings and waste activated sludge sized to local haul-off economics — typically targeting 18–25% dry solids cake for FOG-rich DAF sludge and 22–28% for waste activated sludge.
| Stage | Unit Operation | Typical Removal / Performance | Key Operating Target |
|---|---|---|---|
| 1 | Rotary bar screen | Removes >2 mm solids | 2–6 mm opening |
| 2 | DAF | 60–90% FOG, 70–90% TSS | Air:solid ratio 0.005–0.060, 4–300 m³/h |
| 3 | Equalization + dosing | pH and load smoothing | 8–24 h HRT, pH 6.5–7.5 out |
| 4 | BNR or MBR | BNR: TN <10 mg/L; MBR: TSS <1 μm effluent, MLSS 8,000–12,000 mg/L | DO 1.5–2.5 mg/L; FRT/HRT per design |
| 5 | Disinfection (ClO₂ or UV) | Fecal coliform reduction to local limit | Per receiving sewer residual cap |
| 6 | Plate and frame filter press | Cake 18–28% DS depending on stream | Match haul-off frequency |
Parameter Targets: What the POTW Will Actually Test
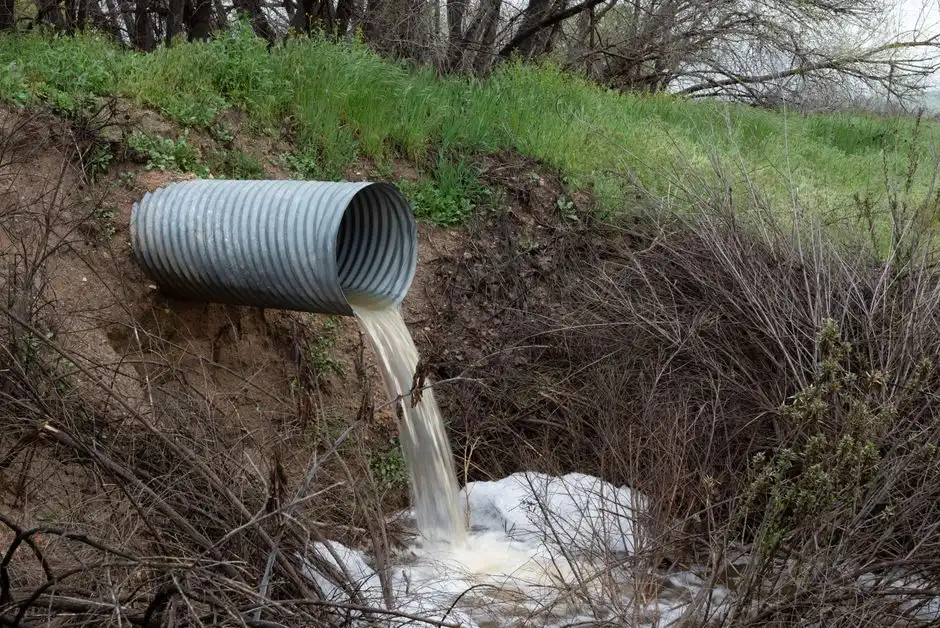
The compliance conversation becomes concrete once the operator knows which numbers an inspector will actually pull off the auto-sampler. The table below maps the typical F&B influent range, the 40 CFR Part 403 categorical target where one applies, and a realistic post-train effluent the engineer should be designing to. The inspector's three favorite slug-load triggers — instantaneous pH, instantaneous FOG, and 24-hour composite BOD — are the parameters that most often drive violations in this region, not the long-term averages.
| Parameter | Typical F&B Influent | 40 CFR Part 403 Categorical (where applicable) | Realistic Post-DAF + BNR/MBR Effluent |
|---|---|---|---|
| TSS (mg/L) | 200–5,000 | Subcategory-specific | <30 (BNR), <1 μm (MBR) |
| BOD₅ (mg/L) | 800–10,000 | Subcategory-specific | <30 (post-MBR), <50 (post-BNR) |
| COD (mg/L) | 1,500–20,000 | Subcategory-specific | <100 typical |
| FOG (mg/L) | 100–3,000 | Local limit often 100 mg/L instantaneous | <25 post-DAF |
| TKN (mg/L) | 20–300 | POTW-specific | <10 post-BNR |
| NH₃-N (mg/L) | 5–50 | POTW-specific | <1 post-nitrification |
| Total Phosphorus (mg/L) | 5–100 | POTW-specific; Everglades overlay | <2 post-BNR with chemical P removal |
| pH | 3–11 | 6.0–9.0 standard; local may tighten | 6.5–7.5 after EQ |
| Flow | Variable batch | Local instantaneous max | Equalized <peak factor> |
Local limits can run tighter than the federal categorical numbers; the operator always honors the stricter of the two, and the design engineer should request the POTW's current TBLL in writing before the P&ID is frozen.
BNR vs. MBR: Choosing the Right Biological Step in 2026
The biological step is the most expensive box on the flow diagram, and the choice between BNR and MBR is the choice that most often gets relitigated after the fact. MBR is the right answer when footprint is constrained (MBR delivers roughly 60% footprint reduction versus conventional activated sludge per MBR Market Growth 2026: Size, CAGR & Buyer Outlook), when FOG or slug variability would upset a clarifier, or when the plant is evaluating water reuse for CIP or boiler feed. BNR (A²/O or MBBR) is the lower-CAPEX option for greenfield sites with adequate footprint, where the local POTW does not require the ultra-low TSS that MBR delivers, and where the dominant compliance driver is nutrients rather than suspended solids. A practical 1-line rule: choose MBR when discharge TSS limits are tight or available space is less than approximately 0.5 m² per m³/day of design flow; choose BNR when land is available and the priority is TN/TP over TSS.
| Axis | BNR (A²/O or MBBR) | MBR |
|---|---|---|
| CAPEX (relative) | Lower (1× baseline) | Higher (1.3–1.8× baseline) |
| OPEX drivers | Aeration energy, sludge hauling | Aeration energy, membrane replacement every 5–8 years |
| Footprint | Larger | ~60% smaller than CAS |
| Operator skill | Standard activated-sludge experience | Adds membrane CIP and integrity testing |
| Effluent TSS | 10–30 mg/L | <1 mg/L (effectively <1 μm) |
| Effluent TN | <10 mg/L achievable | <10 mg/L achievable |
| FOG/slug sensitivity | Moderate — clarifier upset risk | Low — membrane protects effluent |
| Best fit | Greenfield with land, nutrient focus | Tight footprint, TSS cap, reuse target |
For plants evaluating reuse, the MBR membrane bioreactor module paired with downstream RO is the standard 2026 path; for plants that only need sewer compliance, BNR is defensible and cheaper.
2026 Cost Bands and the Selection Framework
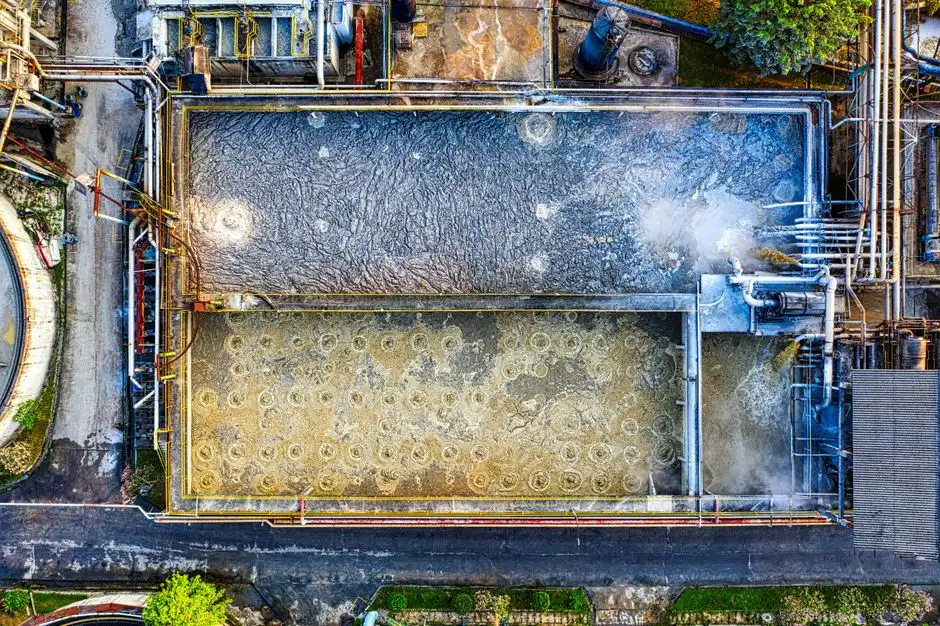
Cost conversations fail when they are presented as single numbers, so the framework below uses order-of-magnitude bands the procurement team can pressure-test. As a 2026 baseline (HydropureWater field data, 2026), a 50 m³/h DAF skid sits in the low six figures, scaling toward seven figures for a 1,000 m³/day packaged MBR. The dominant OPEX line items are coagulant and polymer dosing, MBR membrane replacement on a 5–8 year cycle, aeration energy, and sludge haul-off. The 80/20 sequencing rule is the same regardless of biological choice: invest in good screening, DAF, and equalization first, because the biological step is the most expensive and the easiest to defer if the front of the train is well designed. Reference the Kurita-style full-water-cycle framing from Coagulant Dosing System for Food Processing: 2026 Equipment Selection & Control Guide and the parallel Mexico corridor analysis in How Food & Bev Plants Near Mexico, US Meet Pretreatment Limits (2026 Guide) so pretreatment CAPEX is reviewed against total water OPEX (pre-treatment + utility + process + wastewater), not in isolation. Treat the band as a sanity check, not a quote — site influent, local haul-off rates, and the current categorical subcategory will move the number.
Frequently Asked Questions
What categorical pretreatment standard applies to a Riviera Beach F&B plant?
It depends on the plant's SIC/NAICS code. The operator must first identify the correct 40 CFR subcategory (e.g., 40 CFR Parts 405–471 for food and beverage processes) and then meet both the federal categorical limits and the local POTW's Technically Based Local Limits, with the stricter of the two governing.
Is FDEP approval required for an F&B pretreatment system?
FDEP oversees the NPDES permit framework, and the local POTW acts as the Control Authority. Engineering design submittals for an industrial pretreatment system typically go to the POTW, with FDEP oversight exercised through the industrial user discharge permit and any associated construction approvals.
Why is DAF preferred over a primary clarifier for F&B wastewater?
DAF handles FOG far better than gravity clarification because micro-bubble buoyancy lifts oil and floatable solids rather than waiting for them to settle. Typical DAF performance is 60–90% FOG removal and 70–90% TSS removal, versus generally under 40% FOG removal in a primary clarifier receiving the same F&B influent.
When does an F&B plant need an MBR instead of conventional activated sludge?
MBR is the right choice when discharge limits require very low effluent TSS, when site footprint is constrained, when FOG or slug variability would upset a clarifier, or when the plant is targeting water reuse for CIP, boiler feed, or other process uses.
How does the Lake Worth aquifer affect pretreatment limits?
The local POTW's Technically Based Local Limits factor in the seawater-intrusion risk documented in USGS Water-Resources Investigations Report 77-47 for the Lake Worth shallow aquifer. Nutrient and salinity limits are set conservatively to protect a coastal aquifer that already shows dissolved solids exceeding 500 mg/L along the C-17 Canal corridor and is under documented inland seawater advance.