Why Harare is a permit-grade site, not a sustainability talking point
Lake Chivero sits at 2.0 ± 1.3 mg/L total nitrogen and 0.6 ± 0.3 mg/L total phosphorus, classifying it as hypertrophic, with nearly 70% of annual phosphorus inflows retained in the lake sediments (Wageningen/Gijzen, 2002, re-cited 2024). Hydraulic retention time across rainfall years 1981/82–2000/01 averaged 1.6 ± 1.1 years, dropping to 0.4 years during the heavy-rain monitoring period of 2000–2001 — meaning nutrient flushing is slow even in wet years and effectively absent in drought years. The Mukuvisi and Marimba rivers, the two main inflows, carry more than 50% of their flow as treated wastewater effluent; any new industrial discharge into this catchment adds load to a system that is already overloaded. Harare's distribution losses sit at ±30% (Wageningen, 2002), so make-up cost, rationing risk and ZINWA allocation pressure all trend upward with every new edge or colocation site. The defensible 2026 conclusion: a 2–5 MW Harare data center cannot treat Chivero as a generic sustainability footnote — the cooling-tower blowdown stream is a permit-grade discharge under the Wageningen Harare water-cycle baseline and has to be designed to it.
Sizing the blowdown envelope for a 2–5 MW Harare edge site
A 3 MW Harare site running at Power Usage Effectiveness (PUE) 1.3–1.5 with Water Usage Effectiveness (WUE) of 1.8–2.5 L/kWh draws roughly 3 × 24 / 1.4 = 51,400 kWh/day of IT energy, which at the WUE envelope gives 92,500–128,600 L/day of total site water demand (per Ecologix, 2026). About 60% of that is evaporative loss; the remainder is blowdown plus drift. The standard cooling-tower relationship B = E ÷ (COC − 1) puts blowdown at roughly 25% of make-up at cycles of concentration (COC) 4, and 20% at COC 6 — so a 3 MW site lands at 23,000–32,000 L/day at COC 4 and 18,500–25,700 L/day at COC 6. Effluent temperatures run 30–40 °C, TDS climbs into the 1,200–3,000 mg/L band against a 200–600 mg/L finished Harare Water make-up profile, and the stream carries scaling minerals (Ca, Mg, silica, alkalinity), biocide residuals and leached Cu/Zn (per Ecologix, 2026). This 4–8× concentration factor over makeup matches the Genesis (2026) band cited for Southern-African data center blowdown.
| Parameter | 3 MW Harare edge site at PUE 1.4 | Source |
|---|---|---|
| IT load energy | ≈ 51,400 kWh/day | 3 MW ÷ 1.4 × 24 |
| Site water demand (WUE 1.8–2.5 L/kWh) | 92,500–128,600 L/day | Ecologix, 2026 |
| Evaporative loss (≈ 60%) | 55,500–77,200 L/day | Ecologix, 2026 |
| Blowdown at COC 4 (B = E ÷ 3) | 18,500–25,700 L/day | Genesis, 2026 |
| Blowdown at COC 6 (B = E ÷ 5) | 11,100–15,400 L/day | Genesis, 2026 |
| Blowdown TDS vs make-up 200–600 mg/L | 1,200–3,000 mg/L (4–6×) | Ecologix, 2026; Genesis, 2026 |
| Effluent temperature | 30–40 °C | Ecologix, 2026 |
Regulatory stack: ZINWA, EMA Cap 20:27 and Harare Water trade-effluent consent

Three separate permits have to be threaded in parallel before a 3 MW Harare site can discharge or reuse blowdown. Raw-water abstraction is administered by the Zimbabwe National Water Authority (ZINWA) under the Water Act, with allocations tied to the Manyame catchment; seasonal rationing in drought years is the norm, which is itself a driver for the reuse case. Discharge is licensed by the Environmental Management Agency (EMA) under the Environmental Management Act (Cap 20:27) and an Effluent Discharge Licence, with site-specific limits typically pH 6–9, TDS ≤ 2,000 mg/L, temperature rise ≤ 5 °C above receiving water, no visible oil or grease, and restricted heavy metals. Any sewer pathway to the local treatment works requires a Harare Water trade-effluent consent, which sets tighter caps on BOD, COD, TSS and chloride than the national licence and demands influent characterisation plus peak flow data. Plan a 6–12 month pre-operations window for all three workstreams; the EMA licence and Harare Water consent are separate gates and cannot be skipped by relying on the national one.
Five-stage treatment train for Harare blowdown and on-site wastewater
The defensible 2026 train is equalisation → sand multimedia → DAF → MBR → BWRO (70–75% recovery) → ClO₂/UV polish, sized as a 50–80 m³/day modular skid. Stage 1 is a 20–30 m³ bolted-steel or concrete equalisation tank with 6–12 h HRT and submersible mixers, buffering the 8–10 m³/h peak from a 50 m³/day combined blowdown plus sanitary load. Stage 2 is a multi-media filter for RO pretreatment with a 10–15 µm effluent SDI <5, chosen over US-style self-cleaning spiral filters because the spiral units are harder to source and service in Zimbabwe. Stage 3 is a DAF for TSS and metal-hydroxide removal with PACl 30–80 mg/L plus anionic flocculant 1–3 mg/L; the DAF stage is what hits the EMA heavy-metal and TSS caps. Stage 4 is a MBR skid for combined blowdown and sanitary polishing using a DF-series flat-sheet PVDF module at MLSS 6,000–8,000 mg/L, polishing combined organics to BOD/COD <20 mg/L; the MBR can be skipped on a small edge site if sanitary is segregated to a packaged MBBR upstream of the Harare Water connection. Stage 5 is a BWRO skid for cooling-tower blowdown recovery at 70–75% recovery with antiscalant plus sodium metabisulphite (SMBS) dosing and LSI held between −0.5 and +0.5; permeate TDS of 10–50 mg/L is recycled to the cooling tower, concentrate is routed to sludge handling or a small brine evaporator if a ZLD target is set (per Genesis, 2026; IDE-Tech, 2026). Disinfection polish uses an on-site ClO₂ generator for reuse-pathway disinfection at 0.5–1.0 mg/L residual followed by a UV polish ahead of the cooling tower at 40 mJ/cm² to address biocide-resistant organisms.
| Stage | Equipment | Operating parameter | Target |
|---|---|---|---|
| 1. Equalisation | 20–30 m³ bolted steel / concrete tank, submersible mixers | 6–12 h HRT | Buffer 8–10 m³/h peak |
| 2. Multi-media | Sand + anthracite + garnet, 10–15 µm | SDI <5 | RO pretreatment |
| 3. DAF | DAF, PACl 30–80 mg/L, anionic floc 1–3 mg/L | 5–10% solids recycle | TSS ≤ 20 mg/L, 90–95% metals |
| 4. MBR | DF-series PVDF flat-sheet, MLSS 6,000–8,000 mg/L | Air-scour per membrane area | BOD/COD < 20 mg/L |
| 5. BWRO | FRP vessels, antiscalant + SMBS | 70–75% recovery, LSI −0.5 to +0.5 | Permeate TDS 10–50 mg/L |
| 6. Disinfection | ClO₂ + UV | 0.5–1.0 mg/L; 40 mJ/cm² | Reuse-pathway microbial limits |
BoM, CAPEX and OPEX for a 50–80 m³/day Harare skid
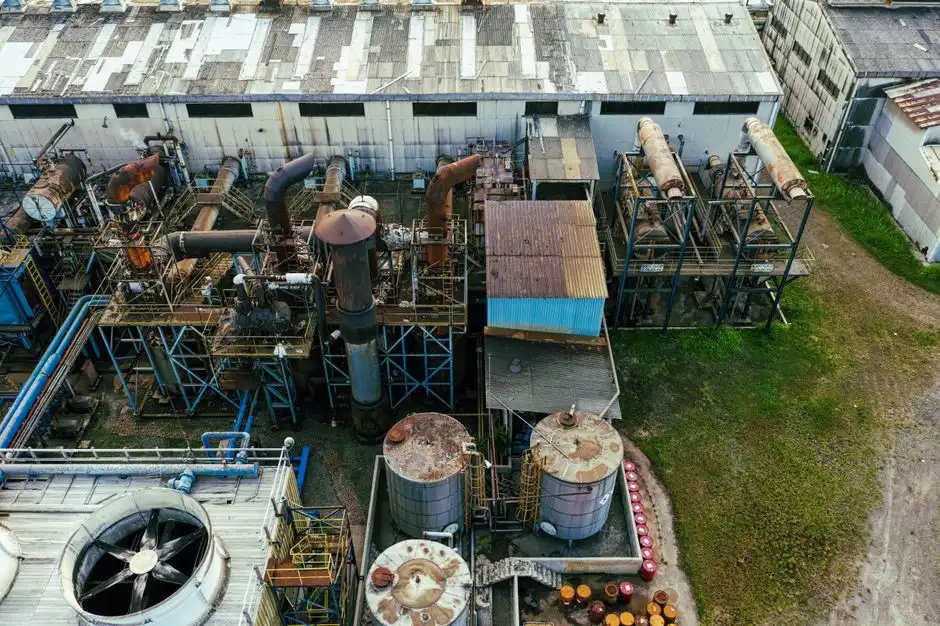
The anchor flow is 50–80 m³/day combined blowdown and sanitary, peaking 8–10 m³/h — sized to sit between the lower and mid-range DAF and DF-series MBR models rather than hyperscale RO + ion-exchange infrastructure, which would push capex per cubic metre 3–4× higher than at 100 MW (per Genesis, 2026). In the 2026 Sub-Saharan market, packaged MBR + UF + RO plants land at USD 250,000–600,000 CAPEX for 50–100 m³/day, with OPEX dominated by antiscalant, biocide rotation and RO membrane replacement every 3–5 years. Recurring chemical lines are antiscalant, a DBNPA plus isothiazolone non-oxidising biocide rotation, and the ClO₂ precursor; SMBS feed is mandatory if any free chlorine carryover reaches the RO. Sludge handling is closed with a plate-and-frame filter press, which cuts hauled-sludge volume and supports the ZINWA water-balance argument. An automatic chemical dosing system sized for the antiscalant, SMBS, biocide and ClO₂ precursor streams keeps the LSI and microbial control inside the bands cited in the previous section, and a DF-series MBR module can be specified as a drop-in for a packaged upgrade path if the site expands from 3 MW to 5 MW.
| Item | Specification | Indicative 2026 USD |
|---|---|---|
| Equalisation tank + mixers | 20–30 m³, 6–12 h HRT | 15,000–25,000 |
| Multi-media filter (sand + anthracite) | 10–15 µm, SDI <5 | 20,000–40,000 |
| DAF + coag/floc dosing | 10 m³/h, PACl 30–80 mg/L | 35,000–60,000 |
| DF-series MBR skid | 10–15 m³/day, MLSS 6,000–8,000 mg/L | 60,000–110,000 |
| BWRO skid + antiscalant + SMBS | 2.5–4 m³/h permeate, 70–75% recovery | 80,000–150,000 |
| ClO₂ generator + UV polish | 0.5–1.0 mg/L; 40 mJ/cm² | 25,000–45,000 |
| Plate-and-frame filter press | 1–2 m³/h, manual / auto | 15,000–30,000 |
| Containerised skid + piping + MCC + instrumentation | 20–40 ft ISO, PLC, SCADA | 50,000–90,000 |
| Total packaged CAPEX | 50–100 m³/day packaged MBR + UF + RO | 250,000–600,000 |
ROI and water-savings argument for a 3 MW Harare site
Pushing COC from 4 to 6 plus closed-loop reuse of the BWRO permeate cuts net make-up by 20–40% (per HydropureWater Lusaka 2026; Genesis, 2026). At a Harare Water commercial tariff in the USD 0.7–1.2/m³ range, recovering even 25,000–30,000 L/day of blowdown repays the packaged CAPEX envelope of USD 250,000–600,000 inside 3–5 years, before counting avoided Harare Water trade-effluent surcharges and EMA non-compliance risk. Genesis (2026) puts direct-discharge fees in water-stressed regions at USD 5–15 per 1,000 gallons — Manyame catchment allocations during drought years push Harare into that band quickly, which is the second leg of the payback argument. The third leg is avoided capacity loss: a site that cannot get a ZINWA allocation at all is a site that does not get built, and a closed-loop train is the only path to a positive water balance in a Manyame-catchment drought year. For peer-reviewed sizing in higher-TDS make-up regions, the Northern Virginia ZLD design reference shows how the concentrate side of the BoM scales when a ZLD target is set.
Frequently Asked Questions
What CAPEX range applies to a 50–80 m³/day packaged data-center treatment skid in Harare in 2026?
For 50–100 m³/day total treatment capacity, packaged MBR + UF + RO plants in the Sub-Saharan market land in the USD 250,000–600,000 CAPEX range in 2026, with OPEX dominated by antiscalant, biocide and RO membrane replacement every 3–5 years (HydropureWater Lusaka, 2026).
What is the realistic BWRO recovery ceiling for cooling-tower blowdown in a Harare edge data center?
Conventional brackish-water RO tops out at 70–75% recovery before scaling becomes unmanageable; pushing past that requires controlled salt precipitation or a brine-concentrator stage, both of which add CAPEX that only pays back on hyperscale flows above roughly 500 m³/day (per IDE-Tech, 2026; Genesis, 2026).
Which three Harare-specific permits gate a data-center blowdown discharge or reuse project?
A ZINWA raw-water permit tied to the Manyame catchment allocation, an Environmental Management Agency (EMA) Effluent Discharge Licence under the Environmental Management Act (Cap 20:27), and a Harare Water trade-effluent consent for any sewer pathway — all three are separate gates and should be run in parallel across a 6–12 month pre-operations window.
What is the Lake Chivero nutrient baseline the EMA submission has to address?
Lake Chivero sits at 2.0 ± 1.3 mg/L total nitrogen and 0.6 ± 0.3 mg/L total phosphorus, with nearly 70% of annual phosphorus retained in the lake and a hydraulic retention time of 1.6 ± 1.1 years across rainfall years 1981/82–2000/01 (Wageningen/Gijzen, 2002). The Mukuvisi and Marimba inflow rivers carry more than 50% of their flow as wastewater effluent, which is why any new Harare discharge has to be designed to that receiving water rather than to a generic national limit.
Related Equipment
- BWRO skid for cooling-tower blowdown recovery — specifications, capacity range, and technical data