What a Lusaka Data Center's Water Balance Actually Looks Like in 2026
A 5 MW Lusaka data center running evaporative cooling at a Power Usage Effectiveness (PUE) of 1.4 draws an IT load of roughly 5 ÷ 1.4 = 3.57 MW, which translates to 3.57 × 24 = 85.7 MWh/day of IT energy. Applying the Water Usage Effectiveness (WUE) benchmark of 1.8 L/kWh — and bracketing that with the 1.8–2.5 L/kWh range that covers most efficient enterprise sites — gives a total site water demand of 1.8 × 85,700 = 154,260 L/day at the low end and 2.5 × 85,700 = 214,250 L/day at the upper end (per Ecologix, 2026). Roughly 60% of that is evaporative loss, with the remainder split between blowdown and drift.
The blowdown volume is governed by cycles of concentration (COC), with the relationship B = E ÷ (COC − 1). At COC 4, blowdown is 25% of make-up — between 38,500 and 53,500 L/day for the Lusaka range above. At COC 6, blowdown drops to about 20%, or 30,800–42,800 L/day. Pushing from COC 4 to COC 6 only buys a 5-percentage-point reduction, not 50%, and biological plus scaling risk rises sharply above COC 5–6 (per Genesis, 2026).
Make-up water in Lusaka is dominated by the Lusaka Water Supply and Sanitation Company (LWSC), which draws from the Kafue River basin. Finished LWSC water typically lands in the 250–450 ppm TDS range, with seasonal conductivity swings driven by the Kafue's dry-season concentration. The local supply context matters because only three data centers are catalogued in Lusaka as of late 2024 — Zambia National Data Centre (two facilities, including LSK2) and NetOne Data Lusaka — and none of them is carrier-neutral (per DataCenterJournal, 2024-12). The engineer reading this guide is most likely an edge or colocation developer adding capacity, not a global hyperscaler, so the right-sized answer sits between 30,000 and 60,000 L/day of blowdown rather than the 1.14–1.70 million L/day hyperscale benchmark cited by Ecologix.
Zambian Compliance Framework: ZEMA, LWSC and the Liquid Effluent Regulations
Every treatment choice on a Lusaka site must trace back to the Zambia Environmental Management Agency (ZEMA), operating under the Environmental Management Act (2011) and the Environmental Management (Liquid Effluent) Regulations. The national limits for liquid effluent discharge are pH 6–9, total dissolved solids (TDS) ≤ 2,000 mg/L, temperature rise ≤ 5 °C above the receiving water, no visible oil or grease, and restricted heavy metals (per ZEMA, 2026). That gives a Lusaka design more headroom on TDS than a US NPDES surface-discharge permit, which typically targets TDS < 500 ppm, but the 5 °C ΔT cap still has to be engineered for.
For blowdown routed to the LWSC sewer — the most common pathway for a Lusaka edge site — a Trade Effluent Consent is required before discharge. LWSC trade-effluent consents are typically tighter than national surface-water limits and impose specific caps on BOD, COD, TSS, chloride, and sometimes hydrocarbons. The consent process involves submitting influent characterisation, proposed pretreatment, and peak flow data; LWSC then issues discharge parameters and sampling frequency. The engineer should treat this as a separate workstream from the ZEMA licence.
A 2026 Lusaka data center should plan for a 6–12 month pre-operations permitting window. ZEMA typically requires either a full Environmental Impact Assessment (EIA) for sites above defined thresholds or a project brief, followed by an Effluent Discharge Licence, ongoing self-monitoring, and annual reporting. Lining this up in parallel with LWSC trade-effluent consent keeps the construction programme on track.
Zambia's framework is not identical to US NPDES, and the comparison is worth flagging: a Lusaka design has roughly 4× the TDS headroom of a US surface-discharge permit but must still demonstrate thermal-plume control on the receiving water. That single difference — TDS limit — is the main reason a Lusaka BoM can be smaller and cheaper than a US equivalent at the same IT load.
Cooling Tower Blowdown Chemistry: Why Lusaka Make-up Water Pushes the System Hard

Cooling-tower blowdown (CTBD) is the purge stream that keeps cycles of concentration (COC) at 4–6, concentrating dissolved silica, calcium carbonate and calcium sulfate in the recirculating water. Conventional brackish-water reverse osmosis (BWRO) systems top out at 75–80% recovery before scaling becomes unmanageable, and pushing past that requires controlled salt precipitation rather than brute-force staging (per IDE-Tech, 2026).
For a Lusaka site, the make-up profile is more aggressive than a temperate-climate design assumes. LWSC finished water typically sits in the 250–450 ppm TDS range with seasonal conductivity swings; the cooling-tower circulating water will concentrate dissolved solids by a factor of 4–6×, pushing blowdown TDS toward the 2,000 ppm mark and effluent temperature to 30–40 °C (per Ecologix, 2026). Lusaka's ambient wet-bulb temperatures — typically 18–22 °C through most of the year — drive higher evaporation rates than a Stockholm or Madrid site would see, which concentrates salts faster and shrinks the safe operating window between blowdown events.
The Langelier Saturation Index (LSI) and Ryznar Stability Index (RSI) frame the chemistry risk. With LWSC make-up at roughly 300 ppm TDS, 80 ppm hardness, alkalinity around 120 ppm, and pH ~7.5, the cooling-tower circulating water will cross LSI > +0.5 at COC 4 unless antiscalant and pH control are applied. Holding LSI between −0.5 and +0.5 is the standard operating band (per Ecologix, 2026); outside that band, calcium carbonate scale fouls heat exchangers and RO membranes.
Biological fouling compounds the problem. First-order biofouling kinetics (k = 0.1–0.5 h⁻¹) predict rapid biofilm growth, and Lusaka's higher ambient temperatures accelerate the reaction rate relative to a Nordic site. A non-oxidising biocide rotation — DBNPA plus isothiazolone — is needed in addition to chlorine dioxide to keep the biofilm growth rate below the cleaning-interval threshold (per Ecologix, 2026). Skipping this step is the most common reason Lusaka MBR and RO membranes fail ahead of their 3–5 year service life.
Recommended Treatment Train for a Lusaka 5 MW Site
The treatment train below is anchored to the ZEMA effluent envelope and the LWSC trade-effluent consent pathway. It is sized for the 30,000–60,000 L/day combined blowdown plus sanitary load of a 5 MW Lusaka edge site.
- Screening and equalisation. A rotary mechanical bar screen (3–6 mm aperture) followed by a 6–12 hour equalisation basin buffers the diurnal blowdown pulse from the cooling tower. The basin also acts as a grit and lint trap before downstream membranes.
- Physicochemical clarification. A DAF clarification skid after coagulant (polyaluminium chloride 30–80 mg/L) and anionic flocculant (1–3 mg/L) dosing removes suspended solids, oil/grease and metal hydroxides. Lime precipitation upstream of DAF achieves 90–95% removal of dissolved metals (per Ecologix, 2026), which is the design basis for meeting the heavy-metal cap in the ZEMA licence. Sludge routes to a small plate-and-frame filter press for dewatering to under 60% moisture.
- Biological polishing (sanitary stream only). An MBR biological polishing unit with submerged PVDF flat-sheet or hollow-fibre modules treats the small sanitary load — typically less than 10% of the total blowdown flow — so that the combined effluent meets ZEMA BOD/COD limits. MLSS is held at 2,000–4,000 mg/L in the aeration tank, with MBR flux managed through automated backwash cycles.
- Membrane polishing for reuse. An UF pre-filtration skid (0.03 µm PVDF) protects the downstream RO from particulates and colloids, with an Silt Density Index (SDI) < 3 guarantee on the UF outlet. A single-pass brackish-water RO unit at 70–80% recovery then polishes the water to near-demineralised quality, with automatic antiscalant and biocide dosing holding LSI between −0.5 and +0.5.
- Disinfection and reuse routing. A chlorine dioxide disinfection system on the RO permeate before it returns to the cooling-tower make-up line, with a UV steriliser (40 mJ/cm² dose) on the smaller side stream feeding toilet flushing, irrigation and chiller-plant wash-water. This side-stream reuse pattern follows the same modular right-sized logic that Genesis applies to colocation sites (per Genesis, 2026).
The full train operates as a closed loop in which only evaporative loss, drift and sludge dewatering need fresh make-up and waste discharge. Combined with the COC 4 → 6 improvement, the net make-up reduction lands in the 20–40% range — a meaningful number in a water-stressed basin. The table below summarises the parameter envelope at each stage.
| Stage | Influent (mg/L or °C) | Effluent target (mg/L or °C) | Removal / control mechanism |
|---|---|---|---|
| Equalisation basin | TSS 50–150, T 30–40 °C | TSS 50–150 (suspended) | 6–12 h HRT, mixing |
| DAF clarification | TSS 50–150, metals | TSS ≤ 20, metals 90–95% removed | Coag/floc + micro-bubble flotation |
| MBR (sanitary only) | BOD 200–400, COD 400–800 | BOD ≤ 30, COD ≤ 100 | Biodegradation + UF retention |
| UF pre-filtration | TSS ≤ 20, SDI ≥ 5 | SDI < 3 | 0.03 µm PVDF, backwash |
| BWRO | TDS 1,500–2,000 | TDS ≤ 50 (permeate) | 70–80% recovery, antiscalant, LSI −0.5 to +0.5 |
| ClO₂ + UV disinfection | Microbial load variable | ClO₂ residual 0.5–1.0 mg/L; UV 40 mJ/cm² | Oxidation + UV inactivation |
Equipment Sizing and Bill of Materials for a 5 MW Lusaka Data Center
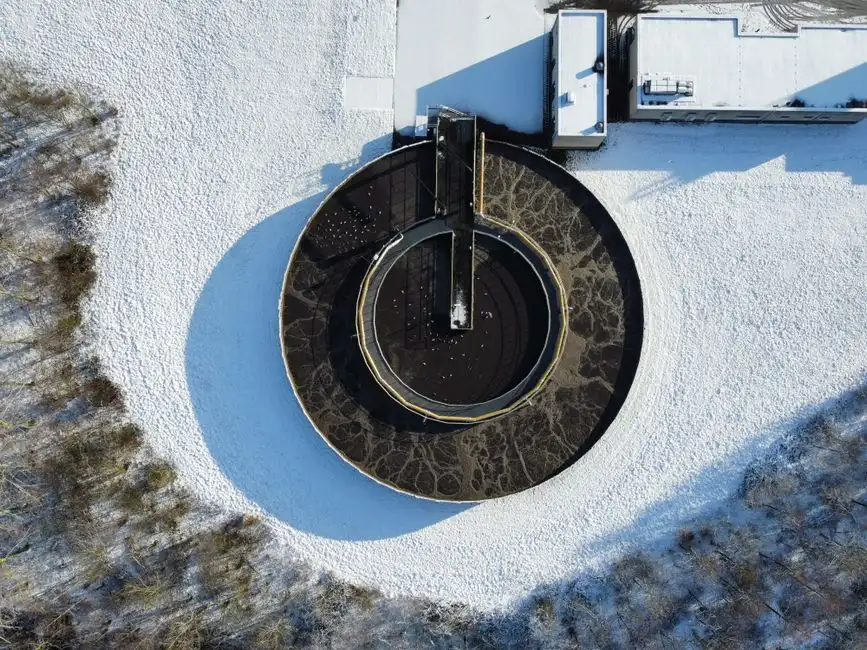
The design flow is anchored at 60 m³/day combined blowdown and sanitary, peaking at 8–10 m³/h. The BoM below maps directly onto the five-stage train above and is sized to sit between the lower and mid-range DAF models. Each item is keyed to a specific duty and a specific ZEMA or LWSC parameter.
| Equipment | Model / spec | Duty / capacity | Driver |
|---|---|---|---|
| Rotary bar screen | GX series, 400–600 mm channel, 3 mm aperture | Peak instantaneous flow, duplex for redundancy | Protect downstream pumps and DAF |
| Equalisation basin | 30–50 m³ bolted steel or concrete | 6–12 h HRT at average flow, submersible mixers | Buffer diurnal blowdown pulse |
| DAF unit | DAF-010, 10 m³/h | TSS, oil/grease, metal hydroxide removal | ZEMA heavy-metal and TSS limits |
| Chemical dosing | PACl 30–80 mg/L, anionic flocculant 1–3 mg/L | Coagulation + flocculation feed | DAF performance, sludge quality |
| Sludge dewatering | Plate-and-frame filter press | Cake dryness < 60% moisture | Sludge handling and disposal |
| MBR (if sanitary included) | DF series, 10–15 m³/day, PVDF flat-sheet or hollow-fibre | MLSS 6,000–8,000 mg/L, air-scour per membrane area | ZEMA BOD/COD, combined effluent quality |
| UF pre-filtration | 2–3 m³/h hollow-fibre skid, auto backwash | SDI < 3 guarantee | RO membrane protection |
| BWRO | 2.5–4 m³/h permeate, single-pass, FRP vessels | 70–80% recovery, antiscalant + SMBS dosing | Reuse make-up water quality |
| Disinfection | ClO₂ generator at 0.5–1.0 mg/L; UV 40 mJ/cm² | Cooling-tower make-up + reuse side stream | ZEMA microbial limits, reuse safety |
| Spare parts / consumables | RO and UF membrane elements, valves, instrumentation | 3–5 year replacement cycle | OPEX continuity |
Two configuration notes are worth flagging for the procurement team. First, the MBR skid is optional if the sanitary stream is segregated and discharged separately to the LWSC sewer; on a 5 MW edge site with fewer than 50 staff, the sanitary load is small enough that an OWTS or packaged MBBR can sit upstream of the LWSC connection without entering the main reuse train. Second, the concentrate from the BWRO can either route to sludge handling or to a small brine evaporator if a ZLD target is set — but for most Lusaka edge sites, sewer discharge of the concentrate under the LWSC trade-effluent consent is the lower-capex choice.
Operating-Cost Logic and Right-Sizing for Lusaka
A 5 MW Lusaka site cannot absorb hyperscale RO + ion-exchange infrastructure — the capex per cubic metre treated would be 3–4× higher than at a 100 MW hyperscaler, and the operational complexity would exceed the local staff capability (per Genesis, 2026). The right answer is a modular 5–10 m³/h skid that delivers roughly 60% of the water savings at one-third the capex per m³.
For 50–100 m³/day total treatment capacity, packaged MBR + UF + RO plants in the Sub-Saharan market land in the USD 250,000–600,000 CAPEX range in 2026, with OPEX dominated by antiscalant, biocide and RO membrane replacement every 3–5 years. The biggest variable on OPEX is membrane life, which is set by feed-water quality and LSI control discipline — a Lusaka site that holds LSI between −0.5 and +0.5 will see 4–5 year membrane life; one that runs hot will see 2–3 years.
On the water-savings side, the COC 4 → 6 improvement plus closed-loop reuse cuts net make-up by 20–40%. At a Lusaka LWSC commercial tariff of roughly USD 0.7–1.2/m³, even 50,000 L/day of recovered blowdown repays the capex inside 3–5 years, before counting the avoided LWSC trade-effluent charges and ZEMA non-compliance risk. For a complete packaged system, the JY integrated water purification platform offers a single-skid alternative for sites that want to consolidate pre-treatment and RO into one unit.
For engineers comparing the Lusaka blueprint against other regional designs, the Madrid data center cooling blowdown treatment guide shows how a higher-TDS make-up profile changes the BoM, while the Stockholm data center cooling blowdown treatment guide demonstrates the cooler-climate scaling case. For a deeper dive into the DAF sizing math that drives Stage 2 of this Lusaka train, the DAF design parameters guide walks through hydraulic loading, air-to-solids ratio and flocculation Gt.
Frequently Asked Questions
How much cooling-tower blowdown does a 5 MW data center in Lusaka produce per day?
A 5 MW Lusaka site at PUE 1.4 with WUE 1.8–2.5 L/kWh draws 154,000–214,000 L/day of make-up water. At COC 4, blowdown is 25% of make-up (38,500–53,500 L/day); at COC 6, blowdown drops to 20% (30,800–42,800 L/day), per the B = E ÷ (COC − 1) relationship.
What are the ZEMA discharge limits for data center blowdown in Zambia?
ZEMA's Liquid Effluent Regulations under the Environmental Management Act (2011) require pH 6–9, TDS ≤ 2,000 mg/L, temperature rise ≤ 5 °C above the receiving water, no visible oil or grease, and restricted heavy metals. Discharge to the LWSC sewer additionally requires a Trade Effluent Consent, which typically imposes tighter BOD, COD, TSS and chloride caps than the national surface-water limits.
What is the recommended RO recovery for cooling-tower blowdown reuse in Lusaka?
Conventional brackish-water RO on Lusaka CTBD is sized at 70–80% recovery, with antiscalant dosing and LSI held between −0.5 and +0.5 to prevent calcium carbonate and calcium sulfate scaling. Pushing recovery higher requires controlled salt precipitation or a brine-concentrator stage, both of which add capex that only pays back on hyperscale flows above ~500 m³/day.
How long does ZEMA permitting take for a new data center in Lusaka?
A 2026 Lusaka data center should plan for a 6–12 month pre-operations permitting window, covering either a full Environmental Impact Assessment or a ZEMA project brief, an Effluent Discharge Licence, and an LWSC Trade Effluent Consent for any sewer discharge pathway. Running these workstreams in parallel with construction is the only way to keep the project schedule intact.