How the Three Zones Drive an AAO System
An AAO (anaerobic-anoxic-oxic) activated sludge system delivers 90–95% BOD5 and SS removal, >70% total nitrogen and around 90% phosphorus when operators hold DO at <0.2 / <0.5 / 2–3 mg/L across the three zones, HRT at 1–2 h / 1.5–2 h / ~6 h, SRT at 8–15 days, F/M at 0.1–0.18 kg BOD5/(kg MLVSS·d), internal recycle at 200–500% and return sludge at 50–100%. The whole train is a coupled optimization problem, not three independent set-points (per Nature 2024, npj Clean Water), and every maintenance task should be traceable back to a specific biological reaction in a specific zone.
The anaerobic zone is the front end of the train and the most oxygen-sensitive volume in the plant. Wastewater from primary clarification mixes with return activated sludge and sits for 1–2 h with DO held below 0.2 mg/L (per S3, snowate.com AAO process reference). Under those conditions, phosphate-accumulating organisms (PAOs) hydrolyze stored polyphosphate, release orthophosphate to the bulk liquid, and take up volatile fatty acids as poly-β-hydroxyalkanoate. This is also where roughly 25–35% of influent BOD is removed before downstream aeration. The maintenance consequence is direct: any DO or nitrate slipping back with the return sludge (>0.5 mg/L combined) collapses the phosphorus-release driving force and tanks biological phosphorus removal performance.
The anoxic zone is sized at 1.5–2 h HRT with DO held below 0.5 mg/L, and is fed by an internal recycle (r) of 200–500% of influent flow pumped forward from the aerobic tank (per S3). Heterotrophic denitrifiers use residual COD as the electron donor to reduce NO3-N returned from the aeration basin back to N2 gas. Holding this zone anoxic — not anaerobic, not aerobic — is the entire control problem: too much DO burns COD through aerobic pathways and starves denitrifiers; too little mixing creates dead pockets where nitrate accumulates instead of being reduced. Note that for a 70% return sludge ratio and 400% internal recycle, theoretical ammonia removal reaches 82.5% (per S3 example calculation), which is why operators trend r aggressively upward when TN is the limiting effluent parameter.
The aerobic zone runs at HRT ~6 h and DO 2–3 mg/L, which is where two things happen in parallel: autotrophic nitrifiers (Nitrosomonas, Nitrobacter) oxidize NH4-N to NO2-N and then to NO3-N, and PAOs that loaded up on VFAs in the anaerobic zone perform luxury P-uptake, drawing orthophosphate into their cells as polyphosphate (per S3). The mixed liquor leaving this tank is split — most flows forward to the secondary clarifier, but a controlled fraction is recycled back to the anoxic zone to feed denitrification. A 2024 multi-objective optimization study (S2, npj Clean Water) confirms that DO, internal recycle ratio and SRT must be tuned jointly to minimize effluent toxicity while meeting COD, TN and TP targets — changing one set-point shifts the optimum of the others.
AAO Operating Parameters: The Single-Page Reference
The table below consolidates the zone-specific and system-wide set-points that an operator needs on a single page next to the SCADA screen. Hold these numbers steady and the biology does the work; drift outside the ranges and the train starts bleeding ammonia, nitrate or phosphorus before any visual symptom shows up at the clarifier.
| Parameter | Anaerobic Zone | Anoxic Zone | Aerobic Zone | System-Wide |
|---|---|---|---|---|
| DO (mg/L) | < 0.2 | < 0.5 | 2 – 3 | — |
| HRT (h) | 1 – 2 | 1.5 – 2 | ~ 6 | 8 – 10 total |
| pH (mixed liquor) | — | — | — | > 7.0 (raise alkalinity if < 6.5) |
| MLSS (mg/L) | — | — | — | 2,500 – 4,000 typical |
| SRT (days) | — | — | — | 8 – 15 |
| F/M (kg BOD5/kg MLVSS·d) | — | — | — | 0.1 – 0.18 |
| Internal recycle r (%) | — | fed from aerobic | pumps to anoxic | 200 – 500% |
| Return sludge R (%) | — | — | — | 50 – 100% |
| COD/TKN ratio | — | — | — | > 4.0 (dose methanol if low) |
| COD/TP ratio | — | — | — | > 20 (dose acetate or VFAs if low) |
| Temperature | — | — | — | < 15 °C depresses nitrification; lower T helps biological P removal |
If the influent COD/TKN ratio drops toward 4.0, supplement with methanol through an automatic chemical dosing system for methanol or acetate supplementation to keep denitrification from going carbon-starved (per S3). For plants with persistent FOG or floatable solids carryover from upstream, a DAF system for FOG and floatable solids removal upstream of the AAO basins protects the anaerobic zone from organic shock and reduces scum buildup on the anoxic surface.
Daily, Weekly and Monthly Maintenance Tasks
The parameter table is only useful if the routine to defend it is on the shift schedule. The cadence below is what a fully staffed AAO plant should run; smaller facilities can roll the daily items into a single morning check and shift the weekly items to a Tuesday round.
Daily tasks. Confirm return-sludge (R) and internal-recycle (r) flow rates against the 50–100% and 200–500% targets, read DO probes in all three zones, log MLSS, SVI and pH on the daily sheet, and walk the deck of the anaerobic and anoxic basins to skim early scum or surface gas-binding (per S3). A 30-point jump in SVI in 24 hours is the first warning of filamentous growth and is easier to address than a clarifier full of bulking sludge on day three.
Weekly tasks. Trend F/M and SRT against the 0.1–0.18 kg BOD5/(kg MLVSS·d) and 8–15 d windows using the average influent BOD5 and the current wasting rate. Review influent COD/TKN and COD/TP ratios — if COD/TKN approaches 4.0, trigger external carbon dosing; if COD/TP approaches 20, prepare an acetate feed (per S3). Pull a nitrate profile across the train to verify that the anoxic effluent NO3-N is dropping as expected and the aerobic effluent NH4-N is below 1 mg/L. For more on how influent ratios drive removal efficiency, see the How to Improve COD Removal Efficiency: 2026 Engineering Guide.
Monthly tasks. Clean DO probes (membrane replacement on older Hach/LDO units), inspect submersible mixers in the anaerobic and anoxic zones for seal weep or shaft play, pull a diffuser and check for fouling or biological scaling, and verify the internal-recycle pump curve against design r = 200–500% with a portable mag meter (per S3). Fouled diffusers can quietly drag aerobic DO from 2.5 mg/L to 1.0 mg/L without triggering an alarm, which is the most common silent nitrification killer.
Quarterly tasks. Profile MLSS and NO3-N across the entire train, inspect the secondary clarifier for rising sludge caused by denitrification in the sludge blanket, and confirm waste-activated-sludge (WAS) rates still support the 8–15 d SRT window. Plants that operate digesters downstream should cross-reference the S4 (SRT/HRT) trends; a useful diagnostic companion is the Anaerobic Digester Troubleshooting: 2026 Diagnostic & Fix Guide.
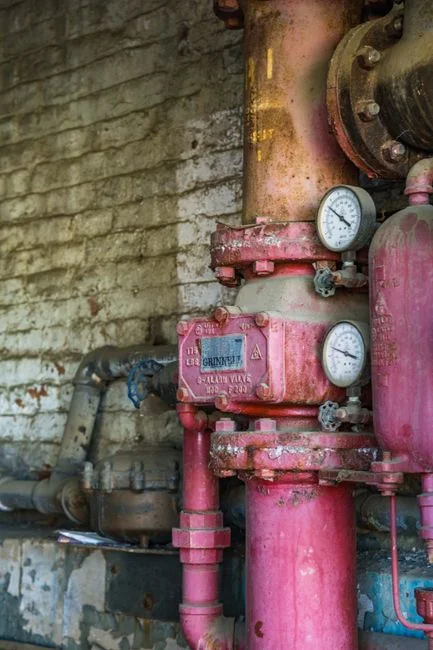
Mechanical reliability. Most AAO upsets blamed on the biology are actually mechanical. Submersible mixers, surface aerators, internal-recycle and RAS pumps, and the bar screen / grit removal upstream all sit in the causal chain — a rotary mechanical bar screen that lets rags through to the anaerobic zone will wrap around a mixer impeller and create a dead spot in hours. Walk the headworks first; the biology is downstream of whatever the screen missed.
Troubleshooting: Symptom, Root Cause, Fix
When the effluent drifts, the fastest path back to compliance is matching the symptom to a probable cause and a defined corrective action. The table below covers the five failures that account for the majority of on-call calls at municipal AAO plants.
| Symptom | Likely Root Cause | Corrective Action |
|---|---|---|
| Nitrification collapse (effluent NH4-N > 5 mg/L) | SRT < 8 d, aerobic DO < 2 mg/L, temperature < 15 °C, or toxic load | Reduce WAS to push SRT to 10–12 d, raise aerobic DO to 2–3 mg/L, check for heavy metals or organic inhibitors, verify alkalinity > 50 mg/L as CaCO3 |
| Effluent TP creeping up with normal TP influent | Return sludge R > 100% pulling NO3-N into anaerobic; anaerobic DO > 0.2 mg/L; COD/TP < 20 | Drop R toward 50–100% lower bound, confirm anaerobic DO < 0.2 mg/L, dose acetate or VFAs to restore COD/TP > 20 |
| Filamentous bulking (SVI > 150 mL/g, poor settling) | Low F/M, nutrient deficiency, septic influent, or low DO in aerobic zone | Adjust F/M toward 0.1–0.18, add micronutrients (N, P, trace metals), recheck anoxic DO < 0.5 mg/L, evaluate chlorination of RAS as last resort |
| Rising sludge in secondary clarifier | Denitrification in sludge blanket; clarifier HRT too long | Reduce return sludge R toward 50% lower bound, increase WAS rate to drop SRT 1–2 d, install scum baffle if not present |
| Foaming or scum on aerobic basin | F/M imbalance, surfactant or FOG load, or high SRT with Nocardia-type growth | Reduce SRT variance, check upstream FOG carryover, confirm DAF or surface skimmer performance, apply chlorination of RAS if foaming persists > 7 days |
Each row in this table maps directly to a set-point in the parameter section — a bulking event that traces to low F/M, for example, is fixed by raising the food supply (more BOD5 load) or by raising the wasting rate to reduce MLVSS until the ratio lands in 0.1–0.18. For a deeper read on biofilm-based alternatives where bulking is structurally impossible, see the How MBBR Works: Engineering Guide to Moving Bed Biofilm Reactors.
Performance Benchmarks and When to Upgrade
Before chasing an upgrade, confirm whether the existing AAO is performing to the typical envelope. The benchmark table below is the reference an operator should compare against before spending capex on a tertiary step.
| Parameter | Typical AAO (well-tuned) | Conventional AAO (average) | Notes |
|---|---|---|---|
| BOD5 removal | 90 – 95% | 85 – 90% | Aerobic HRT is the dominant variable |
| SS removal | 90 – 95% | 85 – 90% | Driven by clarifier performance and SVI |
| Total nitrogen removal | > 70% (r ≈ 400%) | 55 – 70% | Internal recycle ratio is the dominant variable |
| Total phosphorus removal | ~ 90% | 70 – 85% | COD/TP > 20 and anaerobic DO < 0.2 mg/L are critical |
| Effluent NH4-N | < 1 mg/L | 2 – 5 mg/L | Holds above 15 °C with SRT in 10–15 d |
If a plant is hitting these numbers but the discharge permit is tightening — for example, TP < 0.5 mg/L for reuse or TN < 10 mg/L for surface-water discharge — the conventional AAO is at the edge of its envelope and the upgrade path is downstream polishing. An MBR membrane bioreactor for tighter effluent limits beyond conventional AAO pushes SS and turbidity to near-reuse quality by replacing the secondary clarifier with membrane separation, and the multi-media filter for residual solids polishing handles any remaining TSS breakthrough on the way to reuse. The 2024 Nature study (S2) frames future AAO optimization as data-driven, multi-objective tuning driven by online sensors and model-predictive control — operators should expect set-points to be revised more often as instrumentation improves, not less.
Frequently Asked Questions
What is the optimal DO set-point for each AAO zone?
Hold DO below 0.2 mg/L in the anaerobic zone, below 0.5 mg/L in the anoxic zone, and 2–3 mg/L in the aerobic zone (per S3). Crossing 0.2 mg/L in the anaerobic tank collapses PAO phosphorus release and tanks biological phosphorus removal within hours.
How long should the sludge age be in an AAO system?
SRT should be controlled at 8–15 days, with 10–12 days as a typical winter target when nitrification slows (per S3). Below 8 days, nitrifiers wash out and effluent ammonia rises; above 15 days, the sludge ages past the point where PAOs retain their luxury uptake advantage.
What is the right internal recycle ratio for nitrogen removal?
The internal recycle ratio r is generally 200–500% of influent flow, with 300–400% typical for plants targeting > 70% TN removal (per S3). A worked example: at R = 70% and r = 400%, theoretical ammonia removal reaches 82.5%.
Which chemical should be dosed for low COD/TKN or low COD/TP?
For low COD/TKN (approaching 4.0), dose methanol as an external carbon source for denitrifiers; for low COD/TP (approaching 20), dose acetic acid or other volatile fatty acids to feed PAOs (per S3). Dosing is most efficiently handled with a paced chemical dosing system tied to the influent flow signal.
How does temperature affect AAO performance?
Above 15 °C, nitrification efficiency holds; below 15 °C, biological nitrogen removal drops significantly and operators typically extend SRT to 12–15 days to compensate (per S3). Counter-intuitively, lower temperatures favor biological phosphorus removal because PAOs outcompete glycogen-accumulating organisms in cold mixed liquor.