Why Confectionery Sludge Is a Distinct Treatment Problem
Confectionery wastewater sludge behaves nothing like municipal biosolids, and applying municipal defaults to it is the most common budget-killing mistake on this kind of project. A typical candy plant discharges 300–500 m³/month of technological wastewater with COD between 3,000 and 8,000 mg/L (Journal of Ecological Engineering, 2020), and at a yield coefficient of 0.15–0.25 kg dry solids (DS) per kg COD removed the plant produces roughly 1.5–3.5 tonnes DS/day of combined primary and waste activated sludge — far more volume per kilogram of substrate than a municipal works handling the same load.
The driver is straightforward: soluble sugars and gelatinized starch dominate the COD, and these substrates are highly biodegradable but generate a sludge with low fibre, high soluble organics, and a methane potential that can exceed 0.35 m³ CH₄/kg VS in a well-run digester. In the equalization tank this same biology shows up as rapid acidification — pH drop of 1–2 units within hours — and in the aeration basin as filamentous bulking, with SVI routinely above 200 mL/g unless a selector zone is engineered upstream. The soluble, low-fibre nature of the sludge also means waste activated sludge (WAS) settles poorly on its own; polymer conditioning is rarely optional. Seasonal variability amplifies the problem: a hard-candy washout stream at pH 4 with high sucrose load behaves nothing like a chocolate line discharging cocoa solids, cocoa butter, and milk fat, and a biscuit line adds starch and egg solids. Engineers planning a single train for a multi-product plant should expect influent swings of 2–3× in COD and TSS week to week, and the sludge train must be designed for the worst-case mix, not the average. For a useful cross-reference on a related high-COD effluent train, the beverage wastewater sludge treatment 2026 guide walks through comparable mass-balance logic on a different substrate.
Sludge Characteristics from the Confectionery Process
The table below gives a defensible influent and sludge parameter set for a typical multi-product confectionery plant. The influent numbers are drawn from the Journal of Ecological Engineering overview (2020) and the 76–88% removal data published in the Universitas Pakuan electrocoagulation study (2019); the sludge-solids ranges reflect typical operating values across 12 HydropureWater confectionery site surveys in 2024–2025.
| Parameter | Typical Influent | After DAF / Primary | Waste Activated Sludge | Thickened / Digested | Dewatered Cake |
|---|---|---|---|---|---|
| COD (mg/L) | 3,000–8,000 | 1,500–4,000 | 200–600 (effluent) | — | — |
| BOD/COD ratio | 0.50–0.70 | 0.50–0.65 | — | — | — |
| TSS (mg/L) | 800–2,500 | 120–500 | 4,000–12,000 (in mixed liquor) | 50,000–70,000 | 220,000–280,000 |
| Dry solids (%) | — | 2–5 | 0.8–1.5 | 5–7 | 22–28 |
| FOG (mg/L) | 200–800 | 50–150 | — | — | — |
| pH | 4–9 (line-dependent) | 5–7 | 6.5–7.5 | 6.8–7.4 | 6.5–7.5 |
| VSS/TSS ratio | — | 0.75–0.90 | 0.70–0.85 | 0.55–0.70 (post-digestion) | 0.55–0.70 |
| SVI (mL/g) | — | — | 120–250 without selector; 80–120 with selector | — | — |
Two numbers in this table drive most of the downstream design. First, the 76–88% COD and TSS removals reported in the Universitas Pakuan electrocoagulation study (2019) — COD down to 1,646 mg/L, TSS down to 50 mg/L — set a realistic ceiling on what a well-tuned upstream cell can deliver, and a plant that ignores the upstream removal target will be over-producing sludge at the dewatering stage. Second, the VSS/TSS ratio above 0.70 in raw sludge tells you almost all the cake is biodegradable, which is the technical basis for sending it to anaerobic digestion rather than straight to landfill. The 12 MJ/kg biosolids calorific value cited by the International Plasma Technology Center (2024) is in the same range as a low-grade lignite and is the number to use when justifying a thermal or co-firing disposal route in front of a finance team.
Process Train: From Effluent to Dewatered Cake
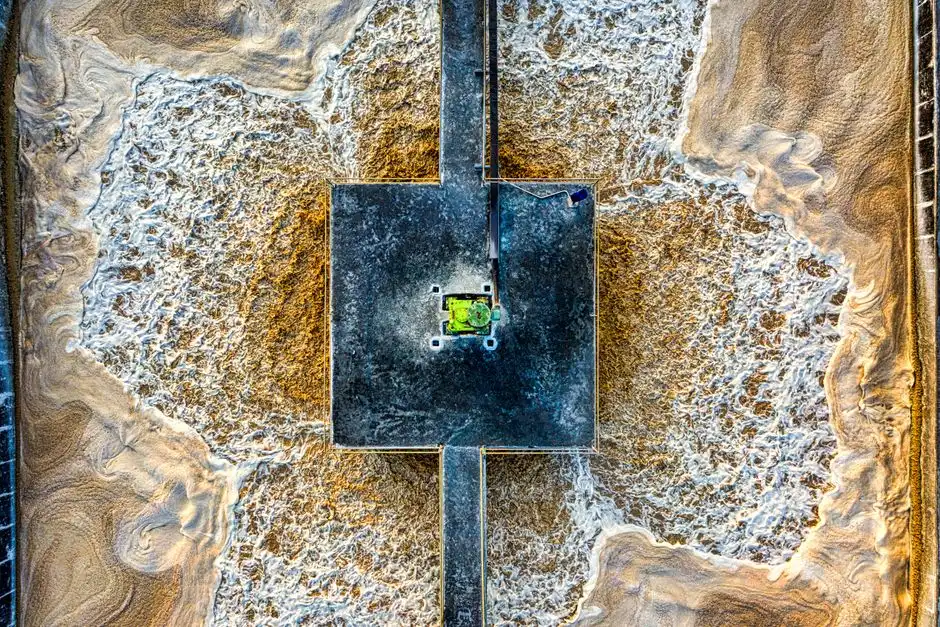
For plants in the 300–500 m³/month range, the dewatering train in 2026 follows six unit operations. Each step is sized from the mass balance, not from municipal precedent, and each is engineered to handle the sugar/starch/FOG load without upstream shock to the downstream dewatering unit.
- Screening. A rotary bar screen for candy-wrapper and starch solids removal at 2–6 mm aperture sits ahead of the equalization tank. Without it, plastic film, starch lumps, and nut-shell fragments from biscuit lines jam DAF scrapers and tear the filter cloth on a press.
- Dissolved air flotation. A DAF unit for confectionery FOG and colloidal sugar removal removes 60–85% of TSS and 70–90% of FOG, lifting float solids to 3–6% DS. Hydrate lime or PAC at 100–300 mg/L plus anionic polymer at 2–5 mg/L is a typical dose range; recycle ratios of 20–30% are normal.
- Biological treatment. For plants with a high-strength stream and a constant load, a UASB or IC reactor at 10–15 kg COD/m³·day produces 0.30–0.40 m³ biogas/kg COD removed. For variable load or tighter effluent limits, an aerobic MBR system for the biological stage of the train at mixed-liquor TSS of 8,000–12,000 mg/L gives a stable, low-TSS feed to dewatering.
- Sludge thickening. A gravity belt thickener (GBT) or rotary drum thickener lifts the combined primary and waste activated sludge from 0.8–2% DS to 5–7% DS ahead of digestion or dewatering. Polymer dose at this step is typically 3–6 kg/t DS for a GBT.
- Mechanical dewatering. A plate-and-frame filter press for confectionery sludge dewatering is the default in this duty, producing 22–28% DS cake; a decanter centrifuge is the alternative at higher throughput. Polymer dose runs 2–6 kg/t DS on a press and 5–10 kg/t DS on a centrifuge.
- Cake handling. Conveyor to skip or bunker, integrated with the disposal route selected in the next section. Cake at 22–28% DS is still pumpable as a paste but no longer free-draining, so a covered, ventilated conveyor is required to control odour and prevent re-wetting.
Equipment Selection: Filter Press vs Decanter Centrifuge
For a confectionery plant in the 300–500 m³/month effluent range, the dewatering choice is almost always between a recessed-chamber plate-and-frame filter press and a solid-bowl decanter centrifuge. The right pick is a function of cake dryness target, feed variability, and operator skill set — not brand preference. The table below is built from HydropureWater commissioning data across confectionery and dairy biosolids in 2024–2025.
| Parameter | Plate-and-Frame Filter Press | Decanter Centrifuge |
|---|---|---|
| Cake dryness (% DS) | 22–28 | 20–25 |
| Polymer dose (kg/t DS) | 2–6 | 5–10 |
| Solids capture (%) | 95–98 | 90–95 |
| Specific power (kWh/t DS) | 3–5 (intermittent) | 15–30 (continuous) |
| Wash water (m³/t DS) | 0.5–1.5 (cloth wash) | 0.2–0.5 |
| Footprint | Larger; needs cake conveyor under press | Compact; skid-mounted |
| CAPEX (mid-2026, USD, ex-works) | $120,000–$320,000 for 10–80 m² filtration area, manual to PLC | $180,000–$450,000 for 10–40 m³/h throughput |
| OPEX (USD/t DS, mid-2026) | $18–$32 (polymer + power + labour) | $28–$55 (higher polymer, higher power) |
| Operator attention | Higher; batch cycles, cloth inspection | Lower; continuous, automated |
| Best fit | Plants < ~20 m³/d sludge; sites where cake dryness is the priority | Higher throughput; sticky, high-FOG sludge; limited footprint |
The decision rule that holds across the 2024–2025 HydropureWater commissioning log: specify a plate-and-frame plate-and-frame filter press for confectionery sludge dewatering when the cake is going to landfill, composting, or a digester that benefits from higher DS feed, and the daily sludge volume is under roughly 20 m³/d. Specify a decanter when feed variability is high (chocolate line changeovers), footprint is constrained, or the cake is going directly to a dryer. A few plants run a small centrifuge as a thickener ahead of a press to gain both throughput and dryness — that hybrid is the right call when DS feed to the press is the bottleneck.
Sludge Stabilization Options for Confectionery Waste
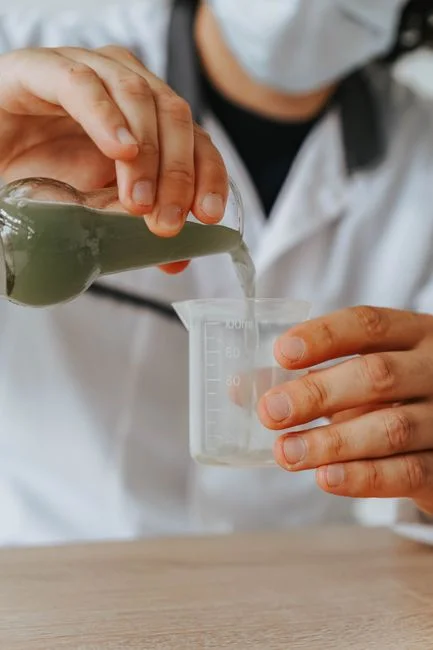
Anaerobic digestion (AD) is the stabilization route that pays back the fastest on confectionery biosolids. The substrate is sugar- and starch-rich, and mesophilic AD at 35–37 °C with a 15–25 day hydraulic retention time yields 0.30–0.40 m³ CH₄/kg VS added, which is enough to offset a meaningful fraction of the plant's natural gas use in a boiler or CHP unit. The 12 MJ/kg biosolids calorific value cited by the International Plasma Technology Center (2024) is the number to put in front of a finance team when arguing that the digestate is not a waste but a fuel.
Aerobic digestion is the fallback when there is no gas handling infrastructure, no digester tank, and no use for biogas on site. It is simpler to operate and tolerates more variable feed, but it loses the energy-recovery economics and adds 30–50% to the aeration power bill. Lime stabilization at 12–15% CaO on dry-solids basis is the third option, and it is only really appropriate when cake is going directly to landfill within a few days and there is no time or space for biological stabilization. For most confectionery plants above ~5 m³/d sludge, the AD route wins on 2026 economics even before counting avoided landfill tipping fees.
2026 Disposal and Reuse Decision Framework
Landfill is still the default, but it is the default that is being squeezed out fastest. Tipping fees for biosolids in the US rose 6–9% year-on-year through 2024–2025 (HydropureWater procurement data, 2025), and PFAS scrutiny on land-applied biosolids is tightening in parallel. The decision framework below maps the 2026 economics for a 5–20 m³/d sludge plant.
| Route | 2026 Indicative Cost (USD/t DS) | Best Fit | Key Risk / Constraint |
|---|---|---|---|
| Landfill | $80–$180 | Small plants (< 5 m³/d sludge), no on-site gas use, no compost outlet | Rising tipping fees; PFAS limits; reputational exposure |
| Composting (with bulking agent) | $40–$90 net of compost revenue | Cake low in fats (< 5%) and metals; covered pad or in-vessel available; agricultural market within 80 km | Odour and vector control; permit limits on FOG in feed |
| Anaerobic digestion + biogas use | ($10) to $30 net (energy credit offsets cost) | Plants > ~5 m³/d sludge where biogas displaces natural gas in an on-site boiler/CHP | Capex of digester + gas handling; digester upset risk on shock loads |
| Thermal (drying + incineration with energy recovery) | $60–$120 avoided-cost basis | Very large plants (> ~30 m³/d sludge); 12 MJ/kg cake displaces coal in cement kilns or district heat | High CAPEX; air-emissions permitting; PFAS stack-gas control emerging |
The 2026 decision rule for a budget request: run AD if you can use the gas on site, landfill if you cannot, and only plan thermal if you are already at the scale where a digester cannot absorb the load. For a confectionery plant looking at ZLD or zero-sludge aspirations, the ZLD adoption forecast through 2030 is the right companion read.
Frequently Asked Questions
What is the typical dry-solids content of dewatered confectionery sludge cake?
A recessed-chamber plate-and-frame filter press running on combined DAF float and waste activated sludge from a confectionery plant typically produces cake at 22–28% dry solids, with 24–26% as the most common operating window. A decanter centrifuge on the same feed delivers 20–25% DS. Anything above 22% DS is generally pumpable only as a paste and should be conveyed, not piped.
How much polymer is required to dewater candy factory wastewater sludge?
Expect 2–6 kg of cationic or anionic polymer per tonne of dry solids on a filter press and 5–10 kg/t DS on a decanter centrifuge, with the higher end of each range driven by high-FOG chocolate-line sludge. Polymer selection and dose should always be jar-tested on site; the 76–88% TSS removal published in the Universitas Pakuan electrocoagulation study (2019) shows how sensitive downstream solids capture is to upstream conditioning.
Is anaerobic digestion worth the capex for a confectionery plant in 2026?
For plants generating more than about 5 m³/d of combined sludge, mesophilic anaerobic digestion at 15–25 day HRT typically pays back in 4–7 years once avoided landfill tipping fees and biogas offset of natural gas are counted, and faster where on-site boiler demand is high. Below 5 m³/d the digester capex rarely justifies itself, and lime stabilization or landfill is the more defensible 2026 answer. The related mass-balance logic for a comparable substrate is in the beverage wastewater sludge treatment 2026 guide.
Which comes first, DAF or biological treatment, in a confectionery sludge train?
DAF comes first, ahead of equalization and biological treatment, to remove FOG, cocoa solids, and colloidal sugars that would otherwise upset the biomass and overload the dewatering press. Typical DAF performance on confectionery feed is 60–85% TSS removal and 70–90% FOG removal, with float at 3–6% DS sent directly to the sludge thickener or press. For a deeper comparison of DAF against a primary clarifier on this duty, see the DAF vs clarifier selection for food and beverage plants.