Why Beverage Plant Sludge Demands Its Own Process Train
Beverage wastewater sludge behaves nothing like municipal biosolids, and treating it as if it does is the single most common cause of operating pain at soft-drink, brewery, and juice plants. Soft-drink effluent carries roughly 10–12% w/v dissolved carbon in the form of sugars, plus suspended solids and pH swings of 2–3 units during CIP chemical discharges (per ScienceDirect 2018, Anaerobic digestion of soft drink beverage waste and sewage sludge). That sugary, rapidly acidifying profile produces a voluminous waste-activated sludge (WAS) that is carbon-rich and nitrogen-poor — the inverse of the C/N balance most municipal digesters are tuned for.
The economic consequences are heavy. Biosolids management accounts for up to 50% of total WWTP OPEX at many facilities (per ScienceDirect 2018), so the sludge line is not a downstream afterthought — it is the cost center that decides whether the liquid train is worth running. Characterization of the dry solids from a beverage WWTP gives a composition of 45.19% C, 42.99% O, and a calorific value of 5,042 cal/g — well within the 2,627–6,000 cal/g heating-value band reported for high-quality sewage sludges, and genuinely fuel-grade (per Nature Scientific Reports 2022, Experimental and simulation analysis of biogas production from beverage wastewater sludge).
That composition reframes the problem. Beverage sludge is not a disposal liability; it is an underused feedstock. The rest of this article walks through the four stages that turn that feedstock into either a reusable biosolids product or an on-site energy stream: thickening, stabilization, dewatering, and end use. Each stage has a specific decision point — and mis-sizing any one of them propagates into the next. For engineers specifying or upgrading the downstream train at an existing plant, the comparison between MBR vs conventional activated sludge for food and beverage plants sets up the WAS production rate the rest of the line has to absorb.
The Four-Stage Sludge Treatment Train
A beverage-plant sludge train is a four-stage flow: thickening, stabilization, mechanical dewatering, and end use. Skipping a stage or sizing it from municipal defaults is where CAPEX overruns start.
Stage 1 — Thickening. The goal is to push dilute WAS (typically 0.5–1.5% DS) up to 4–6% DS before digestion or dewatering. Two workhorse options dominate: gravity belt thickeners (GBTs) for straightforward WAS, and dissolved air flotation (DAF) thickening for streams carrying fats, oils, and grease (FOG) or floatable solids from fruit-juice lines. A DAF unit recovers floatable solids efficiently and is the better choice when the upstream bioreactor periodically sloughs high-FOG biomass; sizing is normally driven by hydraulic loading rather than solids loading. For a worked example, a 1,000 m³/d plant with ~2,000 mg/L BOD influent produces on the order of 800–1,200 kg/d of dry solids after digestion — a number that frames every equipment decision downstream.
Stage 2 — Stabilization. Mesophilic anaerobic digestion is the design anchor: 35 °C, pH 8.5, organic loading ratio 1:3, and a 30-day HRT, as optimized in the Nature 2022 bench study using 20 L fed-batch reactors. Co-digestion with sewage sludge at 20% v/v beverage waste raises biogas output by 191% at the optimum (per ScienceDirect 2018) — a result that should reshape the digester business case at any plant with spare hydraulic capacity.
Stage 3 — Dewatering. Digested biosolids at 1.5–3% DS are dewatered with either a decanter centrifuge or a plate-and-frame filter press. Polymer conditioning with cationic polyacrylamide typically runs 5–12 kg polyelectrolyte per ton of dry solids, depending on the equipment and target cake dryness.
Stage 4 — End use. The cake (18–30% DS) goes to land application (US/Australia), incineration (EU), or on-site energy recovery via CHP. The economic split between these routes is where 2026's tightening rules start to matter.
| Stage | Equipment | Key Parameter | Typical Range |
|---|---|---|---|
| 1. Thickening | Gravity belt / DAF thickener | Output DS | 4–6% |
| 2. Stabilization | Mesophilic anaerobic digester | Temp / pH / HRT / OLR | 35 °C / 8.5 / 30 d / 1:3 |
| 3. Dewatering | Centrifuge or filter press | Cake DS | 18–30% |
| 4. End use | Land apply, incinerate, CHP | Decision driver | Regulation / gate fee / energy price |
Anaerobic Digestion: Where Beverage Sludge Becomes an Asset
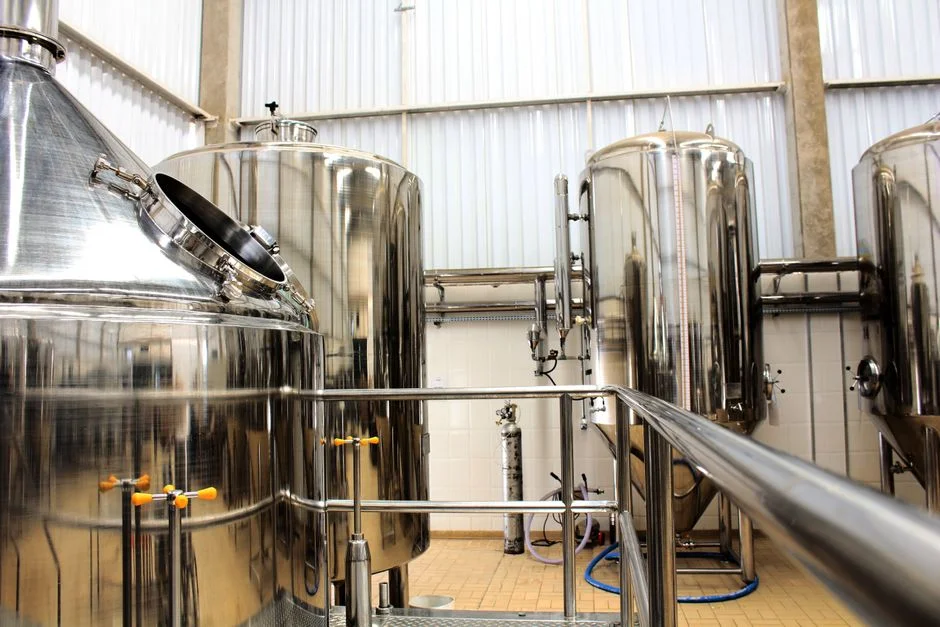
The bench-scale numbers are striking: 15.4 m³ of biogas per kg of volatile solids added, with 9.3 m³ total gas produced from a 20 L reactor at the optimum operating point (per Nature Scientific Reports 2022). Methane content measured 61.11% CH₄ — a value that, when fed to a standard combined-heat-and-power unit at 35–40% electrical efficiency and 85–90% thermal efficiency, converts a digester from a compliance cost into a measurable revenue stream.
Four operating variables drive the result: temperature (25/35/45 °C), pH (5.5–9.5), organic loading ratio (1:3 to 1:6), and HRT (fixed at 30 days in the bench work). The optimum combination is 35 °C, pH 8.5, and OLR 1:3 — mesophilic conditions that match standard municipal digester practice but with a slightly more alkaline setpoint to handle the rapid sugar hydrolysis. Deviating from pH 8.5 to either end of the tested range reduced gas yield materially; the same was true for both lower (25 °C) and higher (45 °C) temperature setpoints, which is consistent with mesophilic methanogen kinetics.
The C/N pairing is what makes beverage sludge a co-digestion prize. The accepted optimum C/N ratio for anaerobic digestion is 15:1 to 30:1 (per ScienceDirect 2018). Sewage sludge sits below this band; beverage waste sits well above it. Blending the two streams closes the gap and simultaneously boosts gas output. The same ScienceDirect study showed a 191% biogas uplift at 20% v/v beverage waste in the feed — but the same mechanism that delivers the upside can deliver a process crash if the mixing ratio is wrong. Rapid hydrolysis of sugars produces volatile fatty acids faster than methanogens can consume them; VFAs accumulate, pH drops, and methanogenesis stalls (per ScienceDirect 2018). Operationally, this means on-line VFA monitoring and a tight anti-foam / alkalinity dosing protocol. The digester design must also address struvite scaling prevention in digesters when phosphorus-rich return streams are co-digested — a chronic pain point that has tripped up multiple retrofits.
Thickening and Dewatering Equipment: What to Specify in 2026
Procurement decisions live or die on a small number of specification numbers. The table below is the document a buyer should be able to print, attach to an RFQ, and defend in a vendor meeting.
Gravity belt thickener (GBT). Output 4–6% DS, hydraulic loading 800–1,200 kg DS/m²·h on the belt, polymer dose 3–6 kg/t DS, low power draw, open-frame construction. Best fit for straightforward WAS at plants above 200 m³/d. Belt width selection follows from peak hourly DS mass and the manufacturer's loading curve.
DAF thickening. Particularly effective for FOG-laden streams and beverage lines that periodically discharge floatable pulp or fruit solids. The DAF line family covers 4–300 m³/h across 13 models, with air-to-solid ratio and recycle rate as the key setpoints; a DAF thickener is the right choice when upstream screening is insufficient and floatable loads are variable. Polymer dose for DAF is typically lower than for GBT — 2–4 kg/t DS — because floatation mechanics differ from belt capture.
Decanter centrifuge. Continuous operation, cake at 22–28% DS, capacity 25–40 m³/h depending on bowl diameter and scroll differential speed, polymer 5–10 kg/t DS, power draw in the 30–70 kW range for mid-size units. Enclosed housing is preferred for odor control. Best fit when continuous throughput and a smaller footprint matter more than ultimate cake dryness.
Plate-and-frame filter press. Batch operation, cake at 22–30% DS — measurably drier than a centrifuge — and lower polymer consumption (4–8 kg/t DS). Filtration areas from 1 m² (lab/pilot) to 500 m² (full-scale) cover the full beverage plant size range. A plate-and-frame filter press becomes the default specification when the end-use route is incineration or pyrolysis, where every extra point of dryness cuts freight or fuel cost. The trade-off is cycle time and labor for plate shifting, though modern automatic plate shifters largely close that gap.
Belt press. Continuous, 18–22% DS cake, lower CAPEX, suited to plants below 200 m³/d. Lower polymer use than the centrifuge, but the wettest cake of the four mechanical options — a constraint when disposal economics are tight.
Polymer selection across all four is dominated by cationic polyacrylamide for high-organic biosolids. The jar-test protocol should bracket charge density (typically 50–80% for WAS/digested blends) and molecular weight; target is the lowest dose that achieves clear filtrate and a cake within 1–2 points of the equipment's rated DS. An automatic polymer dosing skid with on-line charge-density compensation pays for itself in polymer savings within 12–18 months on any plant above 500 m³/d.
| Equipment | Cake DS (%) | Polymer (kg/t DS) | Capacity Range | Best Fit |
|---|---|---|---|---|
| Gravity belt thickener | 4–6 | 3–6 | 800–1,200 kg DS/m²·h | Straightforward WAS, >200 m³/d |
| DAF thickener | 4–6 | 2–4 | 4–300 m³/h | High-FOG, floatable solids |
| Decanter centrifuge | 22–28 | 5–10 | 25–40 m³/h | Continuous, odor-sensitive sites |
| Plate-and-frame filter press | 22–30 | 4–8 | 1–500 m² filter area | Driest cake; incineration/pyrolysis |
| Belt press | 18–22 | 4–8 | <200 m³/d plants | Lowest CAPEX, small sites |
Compliance, Reuse, and the 2026 Circular-Economy Lens
Three regulatory drivers are reshaping sludge economics in 2026. First, biosolids management remains close to 50% of total WWTP OPEX in EU plants (per ScienceDirect 2018), and most EU sites incinerate — a route now under pressure from emerging Sewage Sludge Directive revisions pushing mandatory phosphorus recovery. Second, the US framework continues to operate under 40 CFR Part 503, with pollutant ceilings and Class A/B pathogen reduction governing land-application routes. Third, methane-leak rules and ESG disclosure are turning digester gas from a thermal byproduct into a reported Scope 1 asset: capturing and combusting digester biogas offsets roughly 0.5–1.2 kg CO₂e per m³ of biogas relative to flaring, depending on engine efficiency and grid mix.
For digested cake, the 2026 end-use menu is: soil amendment after stabilization (US/Australia), brick co-firing or mono-incineration (EU), or pyrolysis feedstock for higher-value biochar markets. The choice is governed less by technology and more by gate fees, transport distance, and the plant's own energy balance. Plant teams moving from a "dispose" to a "circulate" posture are increasingly structuring performance-based wastewater O&M contracts that share the upside of biogas and biosolids revenue with the operator — a contracting model that has materially changed the procurement conversation since 2024.
Frequently Asked Questions
What is the typical biogas yield from beverage wastewater sludge?
At the bench-scale optimum of 35 °C, pH 8.5, OLR 1:3, and a 30-day HRT, beverage wastewater sludge produced 15.4 m³ of biogas per kg of volatile solids, with 61.11% methane content (per Nature Scientific Reports 2022). Full-scale yields track below this because of mixing and mass-transfer losses, but the bench number is the design anchor used in feasibility studies.
How much can co-digestion with sewage sludge increase biogas output?
Co-digesting soft-drink beverage waste with sewage sludge at 20% v/v in the feed raised biogas production by 191% versus sewage sludge alone, at a 171% increase in OLR (per ScienceDirect 2018). The benefit drops sharply above 20% v/v because of VFA inhibition and pH crash risk.
What cake dryness should a beverage plant target for mechanical dewatering?
A plate-and-frame filter press typically delivers 22–30% DS cake; a decanter centrifuge delivers 22–28%; a belt press delivers 18–22%. For incineration or pyrolysis end use, the filter press is generally the lowest-cost route because transport and fuel costs scale with water content.
What is the typical polymer dose for conditioning digested beverage biosolids?
Cationic polyacrylamide doses of 5–12 kg per ton of dry solids are typical, with the lower end achieved by a plate-and-frame press (4–8 kg/t DS) and the higher end by centrifuges (5–10 kg/t DS) and belt thickeners (3–6 kg/t DS for thickening; higher for the dewatering stage).