
Why Fallon Food and Beverage Plants Are Re-evaluating Activated Sludge in 2026
Fallon, US food and beverage plants are running into a wastewater squeeze that conventional activated sludge (CAS) was never sized for. The local influent profile is unusually punishing: dairy and packaged-food operations generate high BOD/COD swings, periodic FOG surges from butter, cheese whey, and sauce cookers, and seasonal harvest peaks that can double organic loading for two to four weeks at a time. Saline groundwater in Churchill County routinely pushes feed-water TDS into the 1,500–3,000 mg/L range, which is high enough to push any reuse stream past typical irrigation thresholds if blending isn't controlled.
On the regulatory side, Nevada Division of Environmental Protection rules under NAC 445A set the binding discharge ceiling for surface discharge, while the EPA 2012 Guidelines for Water Reuse define the quality bar for any irrigation, cooling-tower makeup, or CIP rinse reuse the plant wants to claim (per EPA, 2012). Most Fallon processors are asking the same 2026 question: do we invest in reuse-grade effluent and earn a water offset, or do we keep the cheaper CAS basin and discharge to the City of Fallon sewer under the existing permit? The answer depends on flow, footprint, FOG swings, and whether reuse water is actually on the strategic roadmap.
How Conventional Activated Sludge and MBR Each Work
CAS is a 70-year-old workhorse consisting of an aeration basin where biology consumes organics, followed by a secondary clarifier where biomass settles out as return activated sludge. Separation is by gravity, meaning settleability—measured as the sludge volume index (SVI)—is the single process variable that decides whether the plant works or fails on any given day. Most CAS plants run mixed liquor suspended solids (MLSS) in the 2,000–4,000 mg/L range; push higher and the clarifier overloads.
MBR replaces the clarifier with a submerged ultrafiltration cassette. The biology is still activated sludge, but solids separation is done physically by membranes, typically PVDF flat-sheet at 0.1 μm nominal pore (per the MBR fundamentals guide). Academic work on submerged MBRs confirms that membranes with cut-off in the 0.04–0.2 μm range retain nearly all bacteria and viruses (per S2, 2012 doctoral thesis, Montpellier). Because the membrane is doing the separation, MBR can run at 8,000–12,000 mg/L MLSS without losing solids. Aeration in an MBR has three jobs: oxygen supply, airlift circulation of mixed liquor across the membrane surface, and continuous scouring that keeps foulants from accumulating (per S2). Commercial packaged integrated MBR systems are typically rated from 10 to 2,000 m³/day and deliver <1 μm filtered effluent in roughly 60% of the footprint of an equivalent CAS train.
MBR vs CAS Head-to-Head on Effluent, Footprint and Sludge
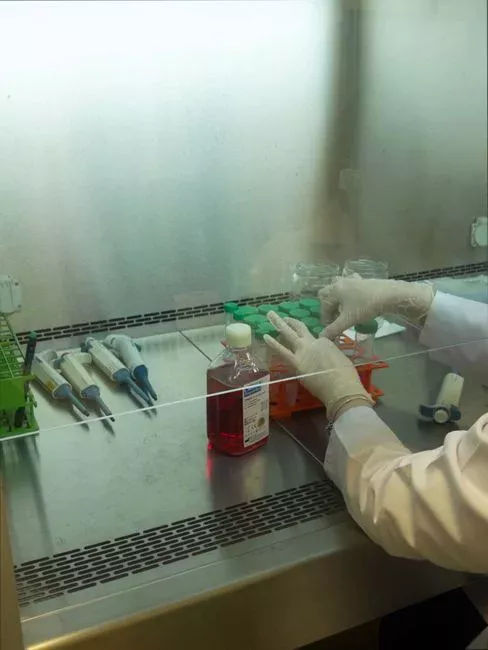
The parameter table below provides the head-to-head comparison most Fallon engineers require. Values are typical operating ranges for packaged food, dairy, and beverage plants at flows of 50–500 m³/day; specific design numbers must be confirmed against the influent characterization.
| Parameter | CAS (conventional activated sludge) | MBR (membrane bioreactor) |
|---|---|---|
| Effluent TSS | 10–30 mg/L (gravity clarifier) | <1–5 mg/L (membrane barrier) |
| Effluent BOD / COD | <30 mg/L BOD with good settling; COD often 60–120 mg/L | <5 mg/L BOD; COD typically <30 mg/L |
| Footprint (same flow) | Benchmark (100%) | ~40% of CAS footprint (60% reduction) |
| MLSS operating range | 2,000–4,000 mg/L | 8,000–12,000 mg/L (membrane retains solids) |
| Observed sludge yield (Yobs) | 0.3–0.5 kg TSS/kg BOD removed | 0.2–0.35 kg TSS/kg BOD (higher SRT) |
| FOG / CIP tolerance | Poor — bulking, foaming, clarifier failure | Good — separation is membrane-driven, not gravity |
| Hydraulic retention time | 6–12 hr (aeration basin) | 4–8 hr (smaller basin, higher MLSS) |
| Disinfection requirement | Usually required for reuse (UV or chlorine) | Greatly reduced — membrane already excludes bacteria/virus |
Academic MBR studies show viability and oxygen uptake rate (OUR) both rise with organic loading rate Cv, allowing an MBR to use higher biomass inventory to absorb loading swings (per S2, 2012). CAS remains adequate—and cheaper—when the only compliance target is sewer discharge at BOD <30 mg/L and TSS <30 mg/L, but it cannot produce reuse-grade water without a downstream tertiary polish step such as UF or RO.
Fouling, FOG and CIP: How Food & Bev Effluent Stress Tests Each System
Food and beverage wastewater is not municipal sewage. Influent typically carries 1,000–5,000 mg/L BOD during a clean-out cycle, 200–800 mg/L FOG from dairy or fryer operations, and CIP surfactants with high pH and temperature swings. In a CAS plant, that combination is the classic cause of filamentous bulking, foaming blankets over the aeration basin, and clarifier failure that takes a plant down for 24–72 hours while the sludge recovers.
An MBR controls fouling through specific operational parameters rather than avoiding it entirely. Research on submerged MBRs shows that very high organic loading triggers an intense fouling dynamic managed through aeration intensity, mixed liquor control, and relaxation cycles (per S2, 2012). In practice, this means a food-plant MBR operator tunes scour-air flow rate (often 0.3–0.6 m³ air per m² membrane area per hour) and mixed liquor temperature rather than worrying about SVI. Because biomass is decoupled from settleability, an MBR running at 10,000 mg/L MLSS continues producing clean effluent even when the FOG load would have broken a clarifier. US pretreatment expectations under 40 CFR 403—categorical standards for dairy, meat, and grain processors—remain the indirect regulatory push driving food plants toward tighter secondary treatment.
Fallon, NV Decision Factors: Climate, Reuse and Permitting
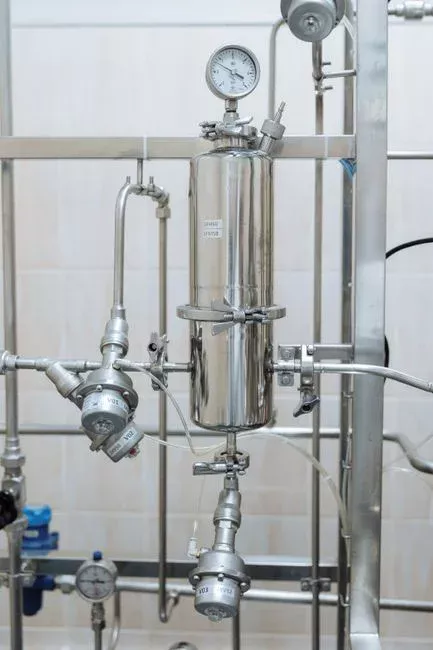
Three Fallon-specific variables tend to decide the project more than the technology itself. First, cold-winter biology: Churchill County air temperatures drop below 10 °C from November through March, and CAS nitrification rates slow visibly at that point. MBR's higher MLSS and enclosed membrane tanks keep biomass more concentrated and insulated, so nitrification holds more reliably through a Fallon winter. Second, reuse opportunity. Fallon-area processors have plausible reuse paths—alfalfa and pasture irrigation, evaporative cooling makeup, and CIP final-rinse water—that map directly to the EPA 2012 reuse quality bar (per EPA, 2012). MBR effluent meets the turbidity and TSS expectations of that guideline, whereas CAS effluent requires a separate UF polish. Third, permitting under NAC 445A. Surface discharge and irrigation reuse paths both favor the lower TSS and turbidity that MBR naturally produces, making the NDEP permit review for an MBR retrofit typically shorter than for a CAS + tertiary polish scheme. Footprint also matters: a smaller MBR package eases siting next to existing production lines without disrupting logistics or expansion plans.
Cost Reality Check: CAPEX, OPEX and the Reuse Payback
On greenfield BOD-only duty, a CAS basin plus clarifier is typically 20–40% cheaper in CAPEX than an equivalent MBR package of the same flow. The MBR premium comes from the membrane cassettes, the stainless frames, the higher-spec blowers, and the controls.
On OPEX, the main MBR energy draw is aeration for membrane scouring (per S2, 2012). Submerged flat-sheet designs such as a DF series flat-sheet MBR module use 10–20× less pumping energy than external cross-flow designs because there is no recirculation loop. Typical MBR specific energy demand sits at 0.4–0.8 kWh/m³ treated, versus 0.2–0.4 kWh/m³ for a CAS basin without a membrane. The reuse side of the ledger often flips the result: at 2026 Fallon municipal water rates, displacing 30–60% of incoming water with on-site reuse typically pays back the MBR CAPEX premium in 3–6 years for a medium-flow food plant. Treat the CAPEX/OPEX split as a sensitivity, and tie it directly to the plant's reuse revenue assumption before issuing any RFQ.
When to Choose MBR, When to Stay With CAS in Fallon
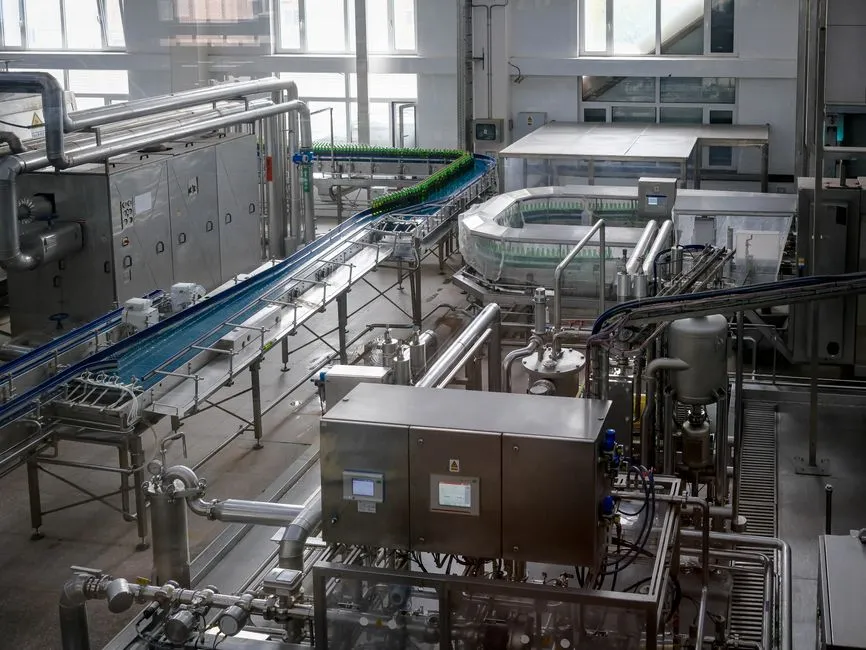
The following matrix serves as a decision aid for projects in Churchill County, mapping common plant scenarios against the right technology choice.
| Plant scenario (Fallon, NV) | Recommended path | Why |
|---|---|---|
| Existing aeration basin, only sewer discharge, BOD-only target | Stay with CAS — optimize SVI control | Lowest CAPEX; reuse not on roadmap; site has basin footprint |
| Existing aeration basin, reuse water wanted in 2–3 years | Hybrid CAS + UF polish | Reuse existing biology; add UF polish system downstream for reuse-grade TSS and turbidity |
| Brownfield retrofit, tight footprint, FOG/CIP swings, reuse required | MBR cassette retrofit into existing tankage, or new packaged integrated MBR system | 60% footprint reduction; decouples biomass from settleability; reuse-grade effluent in one step |
| Greenfield, 100–500 m³/day, high TDS groundwater, future-proofing for reuse | MBR | Higher MLSS, enclosed membranes, straightforward NDEP permit review for reuse |
Choose MBR when reuse is on the table, footprint is constrained, FOG and CIP swings are routine, or a tight TSS limit applies. Stay with CAS—or retrofit a CAS + UF polish—when only sewer discharge is needed, capital is constrained, and the site can absorb a larger basin footprint.
Frequently Asked Questions
How much does an MBR cost versus a CAS basin for a 200 m³/day food plant in Fallon?
For a packaged 200 m³/day food plant in 2026, expect MBR CAPEX to be 20–40% higher than an equivalent CAS basin with clarifier on a greenfield, BOD-only basis (HydropureWater field data, 2026). The OPEX gap narrows once reuse water is valued at Fallon municipal rates; payback on the MBR premium typically lands in the 3–6 year range when 30–60% of incoming water is offset.
Can MBR effluent be reused for irrigation or CIP rinse in Nevada?
Yes. MBR effluent at <1 μm filtration typically meets the turbidity and TSS expectations of the EPA 2012 Guidelines for Water Reuse (per EPA, 2012), which is the baseline NDEP references for irrigation and on-site process reuse. TDS still needs site-specific evaluation because Churchill County groundwater often runs 1,500–3,000 mg/L.
What happens to MBR performance in a Fallon winter?
MBR nitrification holds more reliably than CAS in cold weather because the higher MLSS (8,000–12,000 mg/L) and enclosed membrane tank preserve biomass activity even when mixed liquor drops below 10 °C. CAS nitrification rates slow visibly at that point and often require supplemental carbon or longer SRTs to stay on spec.
How often do MBR membranes need to be replaced in a food plant?
For properly designed submerged PVDF MBRs running food-grade effluent with scour-air control and periodic relaxation, membrane life typically lands at 5–8 years before replacement. CIP chemicals, FOG spikes, and low aeration intensity are the three