
Why Petroleum Wastewater in Inver Grove Heights Demands a Tough Biological Stage
For a petroleum terminal, lube-oil blender, or small refinery discharging within the Inver Grove Heights service area in 2026, the biological stage is the single largest risk to permit compliance. A typical influent envelope runs COD 300–1,500 mg/L, oil and grease 50–500 mg/L with intermittent free-phase spikes, phenols 5–50 mg/L, and ammonia-N 5–30 mg/L, all of it arriving in slugs when tank bottoms are drained or product is transferred (HydropureWater field data, 2026). The Minnesota Pollution Control Agency's industrial pretreatment program and the local POTW discharge standards tighten total residual hydrocarbons, TSS, and ammonia limits well below what a classical activated-sludge train was originally designed to deliver.
Minnesota climate adds a second layer of risk. Winter mixed-liquor temperatures of 8–12 °C in unheated or lightly heated basins suppress nitrification kinetics and extend the time required to hit ammonia targets, which directly inflates aeration tank and clarifier volume in any conventional design. A 50–500 m³/day petroleum site on the Minnesota River basin therefore cannot be sized from a generic municipal template; the envelope, the climate, and the MPCA expectations push the engineer toward a more compact, more completely mixed, more cold-tolerant biological stage.
How Conventional Activated Sludge Treats Refinery Wastewater
The conventional activated sludge (CAS) train at a petroleum site is a long, well-understood sequence: API or corrugated-plate oil-water separator → equalization → primary clarifier → aeration basin operated at MLSS 2,000–4,000 mg/L and HRT 6–10 h → secondary clarifier → sand filter or polishing pond. The EPA Wastewater Management Fact Sheet on Membrane Bioreactors (EPA, 2019) frames the secondary clarifier as the "solids separation device" that defines the CAS effluent envelope — typically 10–30 mg/L TSS and 5–15 mg/L ammonia-N for a properly run refinery aeration basin. Free oil is normally pushed upstream into the API separator, with the equalization basin smoothing batch discharges from the tank farm.
On petroleum duty, the same CAS train develops chronic failure modes. Oil emulsions bleed through the API separator and trigger sludge bulking in the aeration basin; surfactants from product-blending operations drive stable foam; nitrification slows below 10 °C and routinely misses winter ammonia targets; and hydraulic surges from batch transfers scour the secondary clarifier, sending solids over the weir. Sludge yield is also high relative to MBR — roughly 0.3–0.5 kg TSS per kg BOD removed for CAS versus 0.15–0.3 for a long-SRT MBR (HydropureWater field data, 2026) — which means more polymer, more hauling, and a larger dewatering budget. An upstream DAF for free oil and grease removal is the usual add-on when CAS bulking becomes unmanageable.
How an MBR Handles Petroleum Wastewater Differently
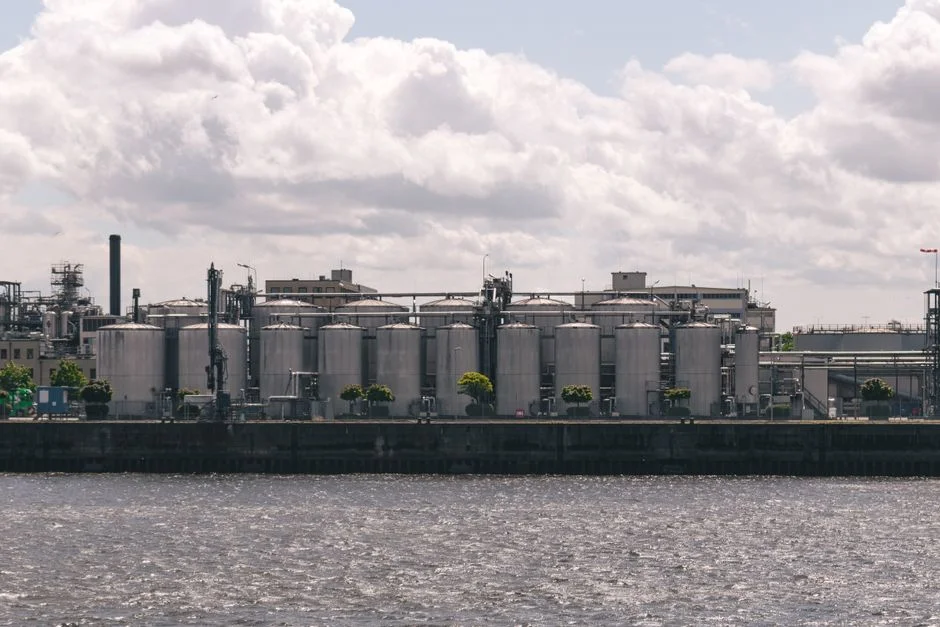
A membrane bioreactor (MBR) replaces the secondary clarifier — and normally the downstream sand filter — with submerged PVDF ultrafiltration membranes sitting directly in the aeration tank, with pore sizes of 0.02–0.1 µm (PCI Membranes; EPA, 2019). Because the membranes retain all biomass and most colloidal material, MLSS can be pushed to 8,000–12,000 mg/L, HRT drops to 3–5 h, and the bioreactor volume comes out roughly 50% smaller than an equivalent CAS basin (EPA, 2019). PCI Membranes notes that complete biomass retention enables higher microbial biodiversity, which favors biodegradation of the recalcitrant compounds — phenols, BTEX, and polyaromatic hydrocarbons — that define petroleum wastewater.
The practical MBR train for a 50–500 m³/day petroleum site looks like: coarse screening → DAF or API oil removal → equalization → 1–2 mm fine screening → aerated MBR tank with an integrated MBR system for 10–2,000 m³/day flows using DF-series PVDF flat-sheet membrane cassettes → permeate disinfection. The EPA fact sheet recommends N+1 redundancy for industrial duty and 1–2 mm fine screening on the membrane feed, both of which are non-negotiable for refinery service because hydraulic surges and grit from product transfers will foul a membrane train in days if not addressed. A useful side-by-side for the technology itself is our foundational MBR explainer, and our sibling MBR-vs-CAS comparison for mining wastewater walks through the same trade-off under a different envelope.
MBR vs CAS for Petroleum Wastewater: Parameter Comparison
The table below compares the two technologies on the parameters a process engineer at an Inver Grove Heights petroleum site must defend. MBR effluent values reflect the EPA Calls Creek dataset (2005) and are typical of a well-run industrial MBR; CAS values are typical refinery-grade ranges rather than a single dataset.
| Parameter | MBR (petroleum duty, typical) | CAS (petroleum duty, typical range) |
|---|---|---|
| Effluent TSS | <1 mg/L (near detection limit) | 10–30 mg/L |
| Effluent BOD | <2 mg/L | 10–30 mg/L |
| Effluent ammonia-N | 0.2–1.0 mg/L (avg 0.21 mg/L at Calls Creek, EPA 2019) | 5–15 mg/L (winter higher) |
| Effluent oil and grease | <5 mg/L with DAF upstream | 10–25 mg/L with API only |
| MLSS in bioreactor | 8,000–12,000 mg/L | 2,000–4,000 mg/L |
| HRT (aeration) | 3–5 h | 6–10 h |
| Bioreactor footprint vs CAS | ~50% smaller (EPA, 2019) | Baseline |
| Sludge yield | 0.15–0.30 kg TSS/kg BOD | 0.30–0.50 kg TSS/kg BOD |
| Specific energy | 0.4–0.8 kWh/m³ (membrane air scour) | 0.2–0.4 kWh/m³ |
| Cold-climate robustness (8–12 °C MLSS) | High — long SRT preserves nitrifiers | Marginal — nitrification rate halved |
| Effluent suitability for RO reuse | Direct RO feed (PCI Membranes) | Requires coagulation/UF polishing |
The ammonia-N line provides a clear performance metric: at Calls Creek, an MBR produced an effluent ammonia-N average of 0.21 mg/L from a 14.8 mg/L influent (EPA, 2019). CAS does not reach that envelope without a separate moving-bed nitrification stage, and even then it struggles in February on a Minnesota site.
Cost and Footprint Reality Check for a 50–500 m³/day Site
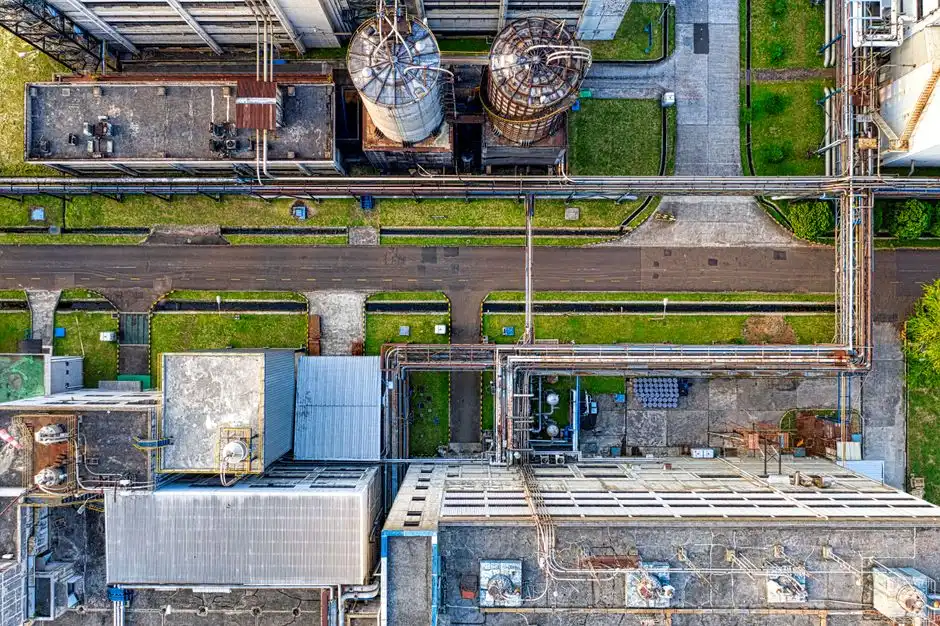
For a 50–500 m³/day petroleum train, 2026 installed CAPEX is roughly US$300–600 per m³/day for a CAS train (API separator + aeration basin + secondary clarifier) and US$500–900 per m³/day for an MBR train (DAF + aeration + membrane cassettes + N+1 redundancy) — treat these as a typical 2026 industrial range to be confirmed by quote (HydropureWater field data, 2026). The CAPEX delta is significant, but it does not account for total lifecycle costs. OPEX on a CAS train is dominated by polymer, sludge hauling, and clarifier maintenance; OPEX on an MBR is dominated by blower energy for membrane air scour, periodic chemical cleaning, and membrane replacement. The EPA fact sheet notes Zenon offers a 10-year membrane guarantee, with others at 3–5 years, which directly affects the lifecycle number (EPA, 2019).
Pulled over a 5-year window, the OPEX gap narrows the lifecycle delta to roughly 10–20% for sites with a tight footprint or strict ammonia limits, because the MBR eliminates clarifier maintenance, drops sludge-hauling volumes by 30–50%, and removes the need for a sand-filter polishing step. The 5-year LCOW is a function of three local variables: electricity cost ($/kWh at the Dakota County meter), local sludge-hauling tip fees, and the resale value of a smaller civil footprint. For a defensible 2026 number, build a 5-year model with blower kWh, membrane replacement year 5 (Zenon-equivalent warranty), and one clarifier-rebuild event on the CAS line. The performance-based O&M contract structure is also worth pressure-testing against both options, as risk transfer to the supplier changes the effective OPEX line by another 5–15%.
When to Choose MBR vs CAS at an Inver Grove Heights Petroleum Site
The decision depends on specific site constraints. Choose MBR when any of the following is true at your Inver Grove Heights site: ammonia-N limit is ≤5 mg/L year-round, available biological-stage footprint is ≤0.5 m² per m³/day, winter mixed-liquor temperature sits at 8–12 °C and nitrification is a permit risk, or the effluent is destined for RO reuse for boiler make-up or truck wash. Choose CAS when a large existing aeration basin is already in place, ammonia is non-limiting (e.g., discharge goes to a POTW headworks with substantial dilution), and the operating team is small but experienced in clarifier operation and sludge wasting. For sites with persistent free oil above 200 mg/L — typical at tank bottoms and lube-oil blender wash bays — specify MBR with an upstream DAF for free oil and grease removal, because micro-bubble flotation is the standard polish step before MBR on refinery duty and prevents irreversible fouling of the cassettes.
The condensed decision rule for a 2026 Inver Grove Heights petroleum project: MBR if ammonia ≤5 mg/L AND footprint ≤0.5 m²/m³/day; MBR + DAF if free oil >200 mg/L; CAS if aeration basin is existing and ammonia is non-limiting; otherwise CAS + DAF + a tertiary sand filter if reuse is not in scope. In every other case, run both trains in a 30-day pilot on the actual tank-farm discharge before committing capital — petroleum wastewater variability is too wide to rely on bench numbers alone.
Frequently Asked Questions
What effluent quality can an MBR reliably hit on petroleum wastewater versus CAS?
On a properly designed industrial MBR, expect TSS <1 mg/L, BOD near detection limit, ammonia-N in the 0.2–1.0 mg/L range (0.21 mg/L average at EPA's Calls Creek reference), and turbidity around 0.3 NTU (EPA, 2019). A conventional CAS train on the same influent typically delivers 10–30 mg/L TSS, 10–30 mg/L BOD, and 5–15 mg/L ammonia-N, with winter values running higher in Minnesota.
Does Minnesota cold-climate operation change the MBR vs CAS decision?
Winter mixed-liquor temperatures of 8–12 °C in unheated basins roughly halve the CAS nitrification rate, so a CAS train that meets ammonia limits in July can fail in February. MBR's long SRT and elevated MLSS (8,000–12,000 mg/L) preserve nitrifier populations at low temperature, which is one of the strongest arguments for MBR at an Inver Grove Heights site that must meet a tight ammonia limit under MPCA pretreatment
Frequently Asked Questions
Is MBR better than activated sludge for refinery wastewater?
Membrane Bioreactor (MBR) systems are generally superior for refinery wastewater because they decouple hydraulic retention time (HRT) from solids retention time (SRT). While conventional activated sludge (CAS) is susceptible to biomass washout during high-flow events or toxic shocks, MBRs operate at higher mixed liquor suspended solids (MLSS) concentrations, typically 8,000 to 12,000 mg/L, providing greater biological stability and resilience against the recalcitrant hydrocarbons common in Inver Grove Heights industrial flows.
What effluent quality does an MBR produce on petroleum wastewater?
MBR technology consistently achieves superior effluent quality compared to secondary clarifiers, typically producing turbidity levels below 0.2 NTU and near-total removal of suspended solids. For petroleum-specific parameters, MBRs can achieve chemical oxygen demand (COD) removal efficiencies exceeding 95% and oil and grease concentrations below 1-2 mg/L, often meeting stringent MPCA discharge standards for local surface waters without the need for additional tertiary polishing stages.
How much smaller is an MBR than a conventional activated sludge plant?
An MBR system typically requires 50% to 70% less physical footprint than a conventional activated sludge plant of equivalent capacity. Because the membrane modules replace the need for large secondary clarifiers and gravity settling tanks, the high volumetric loading rates allow for a compact, modular design that significantly reduces land acquisition and concrete basin construction costs in constrained refinery site settings.
Can a membrane bioreactor handle oil and grease from a tank farm?
MBRs can handle oil and grease, but they require robust upstream pretreatment, such as dissolved air flotation (DAF) or API separators, to prevent membrane fouling. While MBRs are effective at degrading emulsified hydrocarbons, free-phase oil concentrations entering the bioreactor must be kept below 20-50 mg/L to prevent the formation of a hydrophobic layer on the membrane surface, which would otherwise necessitate frequent chemical clean-in-place (CIP) cycles.
What is the 5-year cost difference between MBR and CAS for a 200 m³/day petroleum site?
For a 200 m³/day facility, the 5-year total cost of ownership (TCO) for an MBR is typically 15-25% higher than CAS due to membrane replacement cycles and increased aeration energy requirements for membrane scouring. While CAS has lower operational expenditure (OPEX) due to lower power draw and no membrane maintenance, the MBR becomes cost-competitive when factoring in the avoidance of fines for non-compliance and the elimination of tertiary treatment infrastructure required to reach similar discharge quality standards.