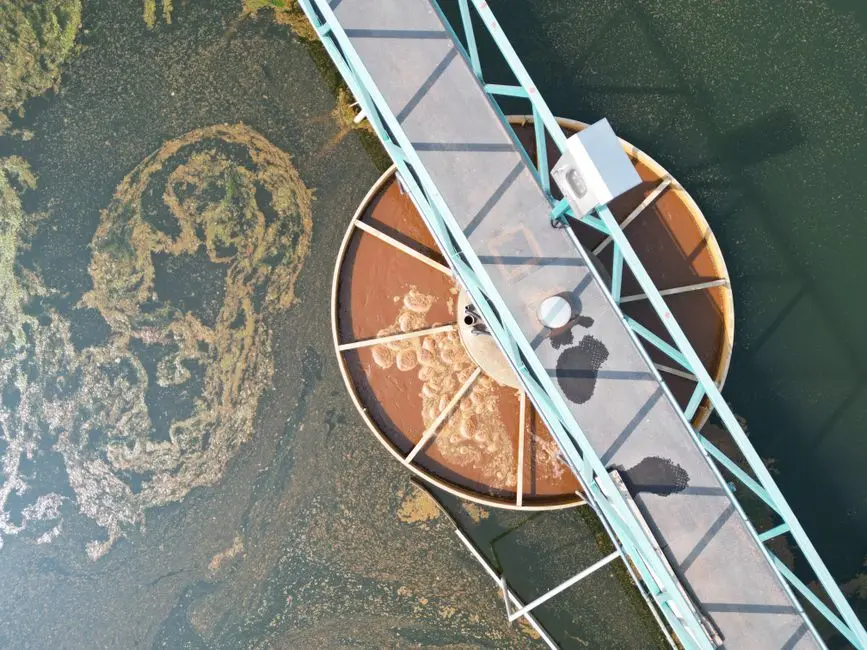
What Poor Sludge Settling Actually Looks Like on the Clarifier
Healthy mixed liquor settles to 20–30% volume in 30 minutes with a clear supernatant, and the sludge blanket sits 0.3–0.5 m below the effluent weir (HydropureWater field data, 2026). When a settling crisis is unfolding, the operator can usually name the failure mode in under two minutes by reading the clarifier deck before running any test. Four visual signatures cover most field events: a hazy supernatant with no distinct blanket; a blanket rising to the effluent weir; pinpoint floc that never compacts; and floating clumps drifting across the launder (HydropureWater field data, 2026).
Floating clumps with a sour odor point to denitrification in the clarifier. A cloudy supernatant with SVI above 150 mL/g points to filamentous bulking. A jelly-like blanket that settles slowly but never clarifies points to viscous bulking. Pinpoint floc with a young, dispersed population points to over-wasting (HydropureWater field data, 2026). Sample at the center well to see what is leaving the aeration basin, and at the effluent launder to see what is leaving the clarifier — the two samples usually disagree by enough to confirm the mode. Walk the deck, write down exactly what you see, and match the visual to a mode before you touch a valve.
The 30-Minute Diagnostic Sequence: From Visual to Root Cause
A settling crisis is not the time for random lab work. The sequence below is the same path most plants walk a new hire through on day one, and it takes about 30 minutes to complete (HydropureWater field data, 2026). Run the steps in order; do not skip microscopy when SVI is in the caution or alarm band.
- Visual signature match. Walk the deck and pick one of the four failure modes from the visual table in the previous section.
- 1 L settle test. Fill a graduated cylinder at the center well, settle for 30 minutes, and record supernatant clarity, sludge volume (SV30), and any floating clumps.
- SVI band check. Compute SVI = SV30 (mL/L) × 1000 / MLSS (mg/L). Bands: <100 healthy, 100–200 caution (run microscope), 200–250 alarm, >250 severe (Trygar/TPO, 2013 per HydropureWater field data, 2026).
- Microscope check. Stalked ciliates and rotifers indicate a mid-age healthy biomass; >5 filaments per floc confirms filamentous bulking (HydropureWater field data, 2026).
- KPI cross-check. Pull DO profile across the basin, MLSS, F/M, and sludge blanket height — alarm if blanket exceeds 0.5 m (HydropureWater field data, 2026).
| Visual signature on deck | What microscope shows | Likely failure mode |
|---|---|---|
| Hazy supernatant, no distinct blanket | Filament bridging, no protozoa | Filamentous bulking / dead zone |
| Blanket rising to weir, floating clumps, sour odor | Gas vesicles on floc, NO₃⁻ >5 mg/L in clarifier | Rising sludge / denitrification |
| Pinpoint floc, turbid effluent, no compaction | Dispersed single cells, very young population | Dispersed growth / over-wasting |
| Jelly-like blanket, slow settling, never clarifies | Heavy EPS sheen, few filaments | Viscous bulking / high SRT |
| Clear supernatant, compact blanket 0.3–0.5 m | Stalked ciliates, rotifers, <5 filaments/floc | Healthy baseline |
KPI Bands by Failure Mode: The Triage Table for Operators
Once the visual is matched, the KPI bands tell the operator whether the numbers confirm the mode or whether they need to keep looking. The four-row triage table below is grounded in the Jenkins et al. (1984) canonical taxonomy, which is still the industry-standard cause-and-effect reference for activated-sludge settling problems (Biological Waste Expert, 2018). The bands reflect conventional activated-sludge operation at 15–25°C; cold-weather plants below 15°C should expect nitrification to roughly halve and should hold SRT at the upper end of each band (HydropureWater field data, 2026).
| Failure mode | SVI (mL/g) | MLSS (mg/L) | DO (mg/L) | SRT (days) | F/M | Blanket (m) | C:N |
|---|---|---|---|---|---|---|---|
| Filamentous bulking | >150 | 2,000–4,000 | Often <2, dead zones | >10 | 0.2–0.4 | >0.5 | Off, often >20:1 |
| Viscous bulking | High, 150–300 | >5,000 | Variable | >12 | <0.1 | Jelly-like, high | Variable |
| Dispersed growth | Low, 50–100 | 1,000–2,000 | 1.5–3.0 | <3 | >0.5 | Thin, diffuse | Often high |
| Rising sludge / denitrification | Moderate, 100–200 | 2,500–4,000 | 0 in clarifier | 10–20 | 0.1–0.3 | >0.5, floating clumps | Low, nitrified |
Sludge blanket height is included because a blanket above 0.5 m produces anaerobic gas lift and rising sludge regardless of how healthy the biology looks on paper (kopayintl, 2025). If the band on any one parameter does not match the visual signature, the failure is mixed-mode and the microscope decides which signal to chase first.
Stop the Bleed: Stabilization Moves for the First Four Hours
The objective in the first four hours is to stop the bleed, not to fix the biology. These moves buy time and protect effluent quality while the longer-term plan is being built. Apply them in order and document each action with a timestamp (HydropureWater field data, 2026).
- Emergency coagulant. Dose PAC or ferrous sulfate at 50–200 mg/L into the aeration basin or clarifier influent to chemically bind flocs (kopayintl, 2025).
- Weighting agent for viscous bulking. Add 5–10% of MLSS as fly ash or diatomaceous earth to increase floc density (kopayintl, 2025).
- Reduce hydraulic load. Temporarily lower influent flow to cut organic loading and give the system room.
- RAS pause and waste. Stop or cut RAS for 1–2 hours to let the blanket settle, then waste the upper poor-quality sludge layer (kopayintl, 2025).
- Hold DO in the clarifier for denitrification. Add light air to the clarifier to hold 1–2 mg/L DO and prevent N₂ gas lift (kopayintl, 2025).
- Clarifier bottom cleaning. Pump out septic sludge from the clarifier bottom to remove the anaerobic gas source.
For plants running hand-mixed polymer, dosing reproducibility is the weakest link in this list; an automatic polymer preparation and dosing unit keeps the activation and dose rate consistent while the operator focuses on the biological fix.
Correcting the Biology: 10–30 Day Recovery Plan by Failure Mode

Once the bleed is stopped, the next one to two sludge ages are where the root cause gets fixed. Sludge age for a conventional system runs 5–15 days, so plan on 10–30 days of corrective operation before the population shift is fully expressed (HydropureWater field data, 2026). Adjust only one parameter at a time and limit wasting changes to ±10–15% per day so the response can be attributed to a specific intervention (HydropureWater field data, 2026). For the wider clarifier-side failure map, see this lamella clarifier troubleshooting guide.
Filamentous bulking. Raise DO to 2–4 mg/L across the full basin and eliminate dead zones. Balance nutrients to a C:N of 10–15:1 and a C:P of 50–100:1 using urea or phosphoric acid dosing. Lower SRT to 5–8 days so filaments wash out faster than floc-formers regenerate — filaments grow slower than floc-formers, so a shorter SRT disproportionately removes them (kopayintl, 2025). Last-resort chlorination at 0.5–1 mg/L Cl₂ at the head of the aeration basin will suppress filaments, but it can also kill floc-formers; deploy only when SVI exceeds 300 mL/g and microscopy confirms filament dominance, and pull daily microscope slides to verify you are not sterilizing the basin (kopayintl, 2025).
Viscous (non-filamentous) bulking. Equalize the feed to hold COD in the 1,000–2,000 mg/L window, hold MLSS at 3,000–4,000 mg/L with an SRT of 8–12 days, and run vigorous but non-shearing aeration at an air-to-water ratio of 12–15:1 — ratios above 15:1 physically shear flocs and worsen turbidity (kopayintl, 2025).
Dispersed growth (young sludge). Pin-floc and turbid effluent with an F/M above 0.5 or an SRT below 3 days is almost always over-wasting. Lower the wasting rate to extend SRT, and re-verify F/M the next morning. Pin floc is the most common self-inflicted settling problem because operators panic at a rising SVI and over-correct with wasting (HydropureWater field data, 2026).
Rising sludge from denitrification. Increase wasting to bleed off nitrate-rich solids faster, and add an anoxic selector ahead of the aeration basin to strip nitrates before the sludge reaches the clarifier. The DO band in the selector is the giveaway — anything above 0.5 mg/L in the selector zone means it is no longer acting as a selector and the nitrates will follow the sludge into the clarifier (HydropureWater field data, 2026).
The Recovery Acceptance Test: How to Know the Fix Held
A fix is not a fix until it survives three consecutive days of normal operation. Recovery is confirmed when SVI sits in the 50–150 mL/g band AND effluent SS stays below 10 mg/L for three consecutive days (kopayintl, 2025). The daily KPI log during this window must include SVI, MLSS, DO, F/M, effluent SS, and a microscope check for the return of stalked ciliates and rotifers as the positive bio-indicator that the population is back in a healthy mid-age (HydropureWater field data, 2026).
| Day | SVI (mL/g) | MLSS (mg/L) | DO (mg/L) | F/M | Effluent SS (mg/L) | Microscope |
|---|---|---|---|---|---|---|
| 1 | Target 50–150 | Per mode target | 2–4 | 0.2–0.4 | <10 | Stalked ciliates returning |
| 2 | Target 50–150 | Per mode target | 2–4 | 0.2–0.4 | <10 | Rotifers present |
| 3 | Target 50–150 | Per mode target | 2–4 | 0.2–0.4 | <10 | <5 filaments/floc, healthy ciliates |
Limit adjustment to one parameter at a time during the test so the recovery is attributable to a specific intervention. Once the test passes, lock the new setpoints (aeration rate, RAS rate, wasting rate) into the SOP and review after one full sludge age of 2–3 weeks (HydropureWater field data, 2026).
When Biology Will Not Hold: Engineered Layers for Chronic Failure
There is a class of plants where influent variability, hydraulic overload, or chronic toxicity keeps the biology in a permanent alarm band regardless of operator skill. For those plants, equipment is not a fallback — it is part of the operating envelope. The table below maps five engineered layers to the failure mode they actually address, with energy and footprint context (HydropureWater field data, 2026).
| Engineered layer | Failure mode it addresses | What it does |
|---|---|---|
| Dissolved air flotation system ahead of clarifier | FOG, colloids, bulking biomass | Strips floatable fraction that overwhelms secondary clarifiers; 4–300 m³/h across 13 models |
| Automatic polymer preparation and dosing unit | Inconsistent chemical conditioning | 100% polymer activation, stable floc formation |
| Jet aeration | Energy-heavy diffused aeration, dead zones | Up to 40% energy reduction vs. diffused air, no in-basin moving parts |
| Integrated MBR membrane bioreactor | Chronic high-MLSS or toxicity | Decouples final solid-liquid separation from biology; effluent TSS no longer rides on SVI |
| Plate and frame filter press for sludge dewatering | Variable upstream sludge quality | 1–500 m² filtration area, PLC-controlled cycles, consistent cake solids |
Capital decisions should be grounded in the specific failure mode that justifies them, not in a generic upgrade. A plant that is chronic on rising sludge does not need an MBR; a plant that is chronic on filamentous bulking from FOG overload does need a DAF pre-strip. For the secondary-clarifier selection logic that pairs with this equipment map, see the industrial secondary clarifier selection matrix; for the hydraulic symptoms that often co-present with settling failure, see the pump cavitation troubleshooting guide.
Frequently Asked Questions
What SVI level means settling failure and when should I act?
Above 150 mL/g is the consensus alarm threshold and the point at which filamentous bulking should be assumed until microscopy proves otherwise (HydropureWater field data, 2026). Earlier EPA small-community guidance used SVI above about 200 mL/g as the bulking marker (EPA, 1977). Above 100 mL/g warrants a microscope check, a DO profile, and a wasting review even if the effluent still looks acceptable.
Is chlorine safe to dose for filamentous bulking, and under what conditions?
Yes, at 0.5–1 mg/L Cl₂ dosed at the head of the aeration basin, but only as a last resort and only with daily microscopy to confirm you are suppressing filaments without sterilizing floc-formers (kopayintl, 2025). Chlorine damages the entire population and a misjudged dose can extend the recovery by weeks.
How long does recovery take, and what are the acceptance criteria?
One to two sludge ages, or roughly 10–30 days, if DO, SRT, and nutrients are corrected together. Filaments wash out faster than floc-formers at SRT 5–8 days, so the population shift is the rate-limiting step, not the chemistry. The acceptance test is SVI 50–150 mL/g AND effluent SS <10 mg/L for three consecutive days (kopayintl, 2025; HydropureWater field data, 2026).
What causes floating clumps on the clarifier, and how do I stop them?
Denitrification in the clarifier — nitrate-laden flocs enter the clarifier, nitrates convert to nitrogen gas, and the bubbles attach to flocs and lift them. Fix it by adding light aeration to the clarifier to hold 1–2 mg/L DO, increasing wasting to bleed off nitrate-rich solids, and adding an anoxic selector ahead of the aeration basin (kopayintl, 2025).
Does an MBR replace biological settling control?
No. MBR decouples final solid-liquid separation from the activated-sludge biology, so the plant no longer depends on a healthy SVI to meet effluent TSS. The activated-sludge biology upstream still needs proper DO, SRT, and F/M control — MBR solves the separation problem, not the biological imbalance that produced the crisis in the first place (HydropureWater field data, 2026).