
What Poor Sludge Settling Looks Like — and How to Solve Poor Sludge Settling
To solve poor sludge settling, identify the clarifier failure mode, then correct DO, SRT, and wasting before adding chemicals. Healthy mixed liquor settles to 20–30% volume in 30 minutes with clear supernatant (S5). SVI above 150 mL/g is the common filamentous bulking alarm; stabilize solids first, then recover biology over 1–2 sludge ages.
Four signatures cover most field events: a hazy supernatant with no distinct blanket; a blanket that rises to the effluent weir; pinpoint floc that never compacts; and floating clumps drifting across the launder. Floating clumps with a sour odor point to denitrification in the clarifier. A cloudy supernatant with SVI above 150 mL/g points to filamentous bulking. A jelly-like blanket that settles slowly but never clarifies points to viscous bulking. Pinpoint floc with a young, dispersed population points to over-wasting. Walk the clarifier deck, sample at the center well and the effluent launder, and match what you see before you touch a valve.
Run the 30-Minute Diagnostic: SVI, DO, MLSS, Microscope
To solve poor sludge settling in an operating plant, run a fixed diagnostic in about 30 minutes, then stabilize solids before changing biology. Rank tests in order, record each result, and do not skip microscopy when SVI is in the caution or alarm band.
A settling crisis is not the time for random lab work. The sequence below is the same path most plants we size for walk a new hire through on day one. Complete each step before moving on.
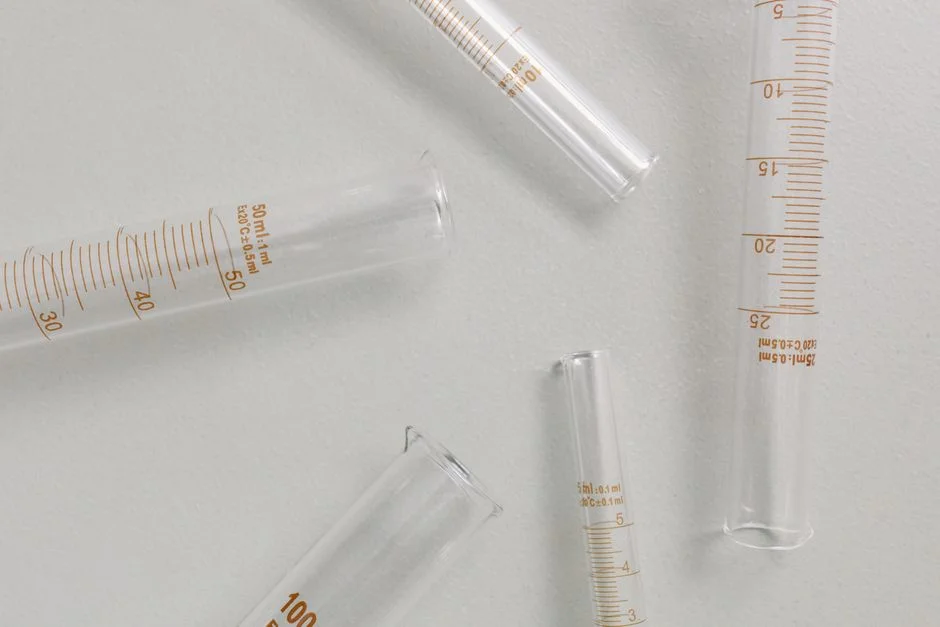
- Step 1 — SVI. Fill a 1 L graduated cylinder with mixed liquor from the aeration basin effluent, let it settle 30 minutes, read the settled volume (mL/L), divide by MLSS (g/L), and multiply by 1000 to get SVI in mL/g. Above 150 mL/g = filamentous bulking alarm, 100–150 mL/g = caution band, 50–100 mL/g = healthy. Above 200 mL/g is a crisis threshold where the clarifier will lose blanket control within hours. Earlier EPA small-community design guidance treated SVI above about 200 mL/g as the classic bulking marker and noted SVI below 100 as good settling at MLSS 1,500–5,000 mg/L (EPA, 1977); later field practice commonly uses >150 mL/g as the filamentous-bulking alarm while keeping the same healthy band.
- Step 2 — DO profile. Walk-probe DO at the head, midpoint, and tail of each aeration lane, plus the corners. Filaments thrive where DO sits below 2 mg/L for more than 15 minutes; persistent readings below 1 mg/L confirm a filament-friendly environment regardless of the average basin reading (S2, S5).
- Step 3 — MLSS. Pull a lab MLSS or read the in-line TSS probe. Above 5,000 mg/L means the system is starving for wasting; below 1,500 mg/L means the biomass has been washed out, usually by over-wasting or hydraulic surge (S2). The conventional operating window is 2,000–4,000 mg/L (S5).
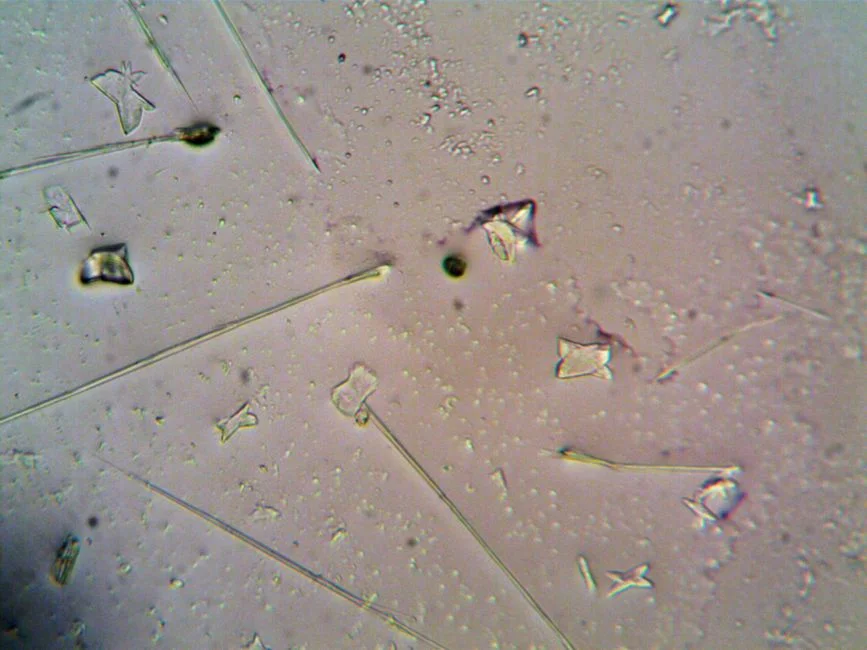
- Step 4 — Microscope. A phase-contrast at 100× confirms whether filaments dominate (extended bridging, >5 filaments per floc) and whether healthy stalked ciliates and rotifers are present as positive bio-indicators (S5). The Jenkins et al. 1984 filament-identification key is still the field reference (S4, 2018-03).
- Step 5 — F/M ratio. Calculate F/M = (influent BOD, kg/d) ÷ (MLSS, kg in aeration). Target 0.2–0.5 for conventional activated sludge (S5). An F/M below 0.1 signals dispersed-growth (young) sludge with pin floc; an F/M above 0.8 signals too little biomass for the load and often coincides with filamentous dominance.
| Step | Test | Healthy | Caution | Alarm | Likely Failure Mode at Alarm |
|---|---|---|---|---|---|
| 1 | 30-min SVI (mL/g) | 50–100 | 100–150 | >150 | Filamentous bulking |
| 2 | DO profile (mg/L) | 2–4 | 1–2 | <1 in any zone | Filamentous bulking / dead zone |
| 3 | MLSS (mg/L) | 2,000–4,000 | 4,000–5,000 | >5,000 or <1,500 | Viscous bulking / washout |
| 4 | Microscope | Stalked ciliates, rotifers, <5 filaments/floc | Some filament extension | Filament bridging, no protozoa | Filamentous bulking |
| 5 | F/M ratio | 0.2–0.5 | 0.1–0.2 or 0.5–0.8 | <0.1 or >0.8 | Dispersed growth / overloading |
SVI, MLSS, DO, F:M, SRT: The Operator's Quick-Reference Bands
Print this table, laminate it, and tape it next to the SCADA terminal. Each row pairs a parameter with three operating bands and the failure mode that the alarm band indicates, so the table doubles as a triage key during the next crisis. Sludge blanket height is included because a blanket above 0.5 m produces anaerobic gas lift and rising sludge regardless of how healthy the biology looks on paper (S2). The bands reflect conventional activated-sludge operation at 15–25°C; cold-weather plants (<15°C) should expect nitrification to roughly halve and should hold SRT at the upper end of each band (S5).
Industry operator guidance also notes that many plants still produce clear effluent with SVI in the 100–200 mL/g range when the plant-specific baseline is known, while SVI of 250 mL/g or higher usually means very slow compaction (Trygar / TPO, 2013). Use your own healthy baseline first; treat the table below as the shared alarm language across shifts.
| Parameter | Healthy | Caution | Alarm | Failure Mode at Alarm |
|---|---|---|---|---|
| SVI (mL/g) | 50–100 | 100–150 | >150 | Filamentous bulking |
| MLSS (mg/L) | 2,000–4,000 | 4,000–5,000 | >5,000 | Viscous bulking / high SRT |
| DO (mg/L) | 2–4 | 1–2 | <1 | Filamentous bulking |
| F/M ratio | 0.2–0.5 | 0.1–0.2 or 0.5–0.8 | <0.1 or >0.8 | Dispersed growth or shock load |
| SRT (days) | 5–15 | 15–20 | >20 | Viscous bulking / pinpoint floc at very low SRT |
| Clarifier blanket height (m) | <0.3 | 0.3–0.5 | >0.5 | Rising sludge / denitrification |
Emergency Stabilization: What to Do in the First 4 Hours
The objective in the first four hours is to stop the bleed, not to fix the biology. These moves buy time and protect effluent quality while you build the longer-term plan in the next section. Apply them in order and document each action with a timestamp.
- Chemical binding. Dose 50–200 mg/L of polyaluminum chloride (PAC) or ferrous sulfate at the aeration basin effluent or the clarifier influent to coagulate loose flocs (S2). This is a band-aid, not a cure — polymer dosing activated sludge at high rates hides the underlying failure and can leave you with a recalcitrant blanket once it stops working.
- Weight the floc. For viscous bulking, add 5–10% of MLSS as fly ash or diatomaceous earth to densify the jelly-like floc and force a compacting blanket (S2).
- Rest the RAS line. Cut or pause return activated sludge for 1–2 hours to let the blanket drop, then waste the upper poor-quality layer to drop MLSS back into the 3,000–4,000 mg/L window.
- Strip denitrification gas. If the failure is rising sludge, add a light air feed to the clarifier to hold 1–2 mg/L DO and strip nitrogen gas from the flocs (S2).
- Reduce hydraulic load. Where storage allows, cut influent flow 10–20% to lower organic shock while the biology recovers. Pair this with remote wastewater plant monitoring to keep setpoints in lockstep with the actual response — see the field data on real-time control and cost savings for the layout.
Biological Correction: The 1–2 SRT Recovery Plan

Once the bleed is stopped, the next one to two sludge ages are where the root cause gets fixed. Sludge age for a conventional system runs 5–15 days, so plan on 10–30 days of corrective operation before the population shift is fully expressed (S5). Adjust only one parameter at a time and limit wasting changes to ±10–15% per day so you can attribute the response to a specific intervention (S5).
Filamentous bulking. Raise DO to 2–4 mg/L across the full basin and eliminate dead zones (S2, S5). Balance nutrients to a C:N of 10–15:1 and a C:P of 50–100:1 using urea or phosphoric acid dosing (S2). Lower SRT to 5–8 days so filaments wash out faster than floc-formers regenerate — filaments grow slower than floc-formers, so a shorter SRT disproportionately removes them (S2). Last-resort chlorination at 0.5–1 mg/L Cl₂ at the head of the aeration basin will suppress filaments, but it can also kill floc-formers; deploy only when SVI exceeds 300 mL/g and microscopy confirms filament dominance, and pull daily microscope slides to verify you are not sterilizing the basin (S2).
Viscous (non-filamentous) bulking. Equalize the feed to hold COD in the 1,000–2,000 mg/L window, hold MLSS at 3,000–4,000 mg/L with an SRT of 8–12 days, and run vigorous but non-shearing aeration at an air-to-water ratio of 12–15:1 — ratios above 15:1 physically shear flocs and worsen turbidity (S2). The fix here is essentially the opposite of the filamentous fix: keep SRT long enough that EPS production drops, but not so long that you slide into the alarm band.
Dispersed growth (young sludge). Pin-floc and turbid effluent with an F/M above 0.5 or an SRT below 3 days is almost always over-wasting. Lower the wasting rate to extend SRT, and re-verify F/M the next morning. Pin floc is the most common self-inflicted settling problem because operators panic at a rising SVI and over-correct with wasting (S5).
Rising sludge from denitrification. Increase wasting to bleed off nitrate-rich solids faster, and add an anoxic selector ahead of the aeration basin to strip nitrates before the sludge reaches the clarifier. The DO band in the selector is the giveaway — anything above 0.5 mg/L in the selector zone means it is no longer acting as a selector and the nitrates will follow the sludge into the clarifier. Reliable chemical support for any of the corrections above benefits from an automatic polymer preparation and dosing unit so the dose and maturation are reproducible rather than dependent on operator hand-mixing.
If the event includes Nocardia-type surface foam, FOG on the blanket, or questions about ciliate recovery while filaments dominate, treat that as a sibling diagnosis path rather than stretching this guide: wastewater treatment bio reactor poor settling, low bugs and high filamentous and a do of 2.3 and a ph of 6.5, how to corresct nocardia and fog on surface sludge blanket.can cilliates repopulate with the nocardia dominating?
When Biology Alone Won't Cut It: Engineered Backup
There is a class of plants where influent variability, hydraulic overload, or chronic toxicity keeps the biology in a permanent alarm band regardless of operator skill. For those plants, equipment is not a fallback — it is part of the operating envelope. The table below maps five engineered layers to the failure mode they actually address, with energy and footprint context.
| Equipment Layer | Failure Mode Addressed | Key Spec | Operating Benefit |
|---|---|---|---|
| Dissolved air flotation | FOG, colloids, bulking biomass ahead of clarifier | 4–300 m³/h, 13 model sizes | Strips the floatable fraction that overwhelms secondary clarifiers |
| Automatic polymer dosing | Inconsistent chemical conditioning | PLC-controlled maturation | 100% polymer activation, stable floc formation |
| Jet aeration retrofit | Chronic low DO / dead zones | Outside-tank mechanical assembly | Up to 40% energy reduction vs. diffused air, no in-basin moving parts (S5) |
| Integrated MBR membrane bioreactor | Decoupling of biology from final clarification | <1 μm flat-sheet filtration | Plant no longer depends on a healthy SVI to meet effluent TSS |
| Plate and frame filter press | Chronic upstream variability in sludge quality | 1–500 m² filtration area, PLC cycle | Consistent cake solids regardless of clarifier performance |
Install a dissolved air flotation system ahead of the secondary clarifier to strip FOG, colloids, and bulking biomass that the clarifier cannot handle — flow range 4–300 m³/h across 13 models. Jet aeration cuts energy use by up to 40% versus diffused air, eliminates in-basin moving parts, and reaches the 2–4 mg/L DO target without dead zones; aeration is 50–90% of total plant energy, so this is where OPEX moves (S5). For plants where chronic high-MLSS or toxicity keeps SVI in alarm, an integrated MBR membrane bioreactor decouples final solid-liquid separation from biology so the discharge TSS target no longer rides on a healthy SVI. Where sludge still has to leave the site, route it through a Plate and Frame Filter Press for Sludge Dewatering with 1–500 m² filtration area and PLC-controlled cycles to dewater consistently regardless of upstream settling quality.
Confirming the Fix: The 3-Day Recovery Acceptance Test
A fix is not a fix until it survives three consecutive days of normal operation. Recovery is confirmed when SVI sits in the 50–150 mL/g band AND effluent SS stays below 10 mg/L for three consecutive days (S2). The daily KPI log during this window must include SVI, MLSS, DO, F/M, effluent SS, and a microscope check for the return of stalked ciliates and rotifers as the positive bio-indicator that the population is back in a healthy mid-age (S5). Limit adjustment to one parameter at a time during the test so the recovery is attributable to a specific intervention. Once the test passes, lock the new setpoints (aeration rate, RAS rate, wasting rate) into the SOP and review after one full sludge age of 2–3 weeks (S5). Plants considering an MBR-based recovery path can benchmark biofilm-based biological design against an MBBR biofilm process design for context, but the acceptance criterion above is what closes out a settling event.
Selection Checklist Before You Change Setpoints or Buy Hardware
- Match the clarifier signature to one failure mode before dosing chemicals.
- Confirm SVI, DO profile, MLSS, microscope, and F/M in that order within 30 minutes.
- Hold DO at 2–4 mg/L across the full basin before you shorten SRT for filaments.
- Change only one wasting or RAS setpoint per day, within ±10–15%.
- Use polymer or PAC only to protect effluent while biology recovers — not as the permanent control strategy.
- If FOG or floatable bulking biomass keeps returning, evaluate DAF ahead of the clarifier.
- If SVI stays in alarm under chronic toxicity or hydraulic overload, evaluate MBR separation and press dewatering as envelope equipment.
Who This Is For / Who Should Look Elsewhere / Next Step
This guide is for plant engineers, shift leads, and EPC teams running conventional activated-sludge clarifiers who need a mode-matched path from visual failure to acceptance test. Look elsewhere if your process is already membrane-based with no secondary clarifier, or if the dominant issue is primary FOG without secondary biology involvement. For sizing help on DAF, dosing, MBR, or press options that match your MLSS and sludge cake targets, request a settling-recovery equipment review with your current SVI, DO profile, and wasting rates.
Frequently Asked Questions
What SVI indicates a settling problem?
Above 150 mL/g is the consensus alarm threshold and the point at which filamentous bulking should be assumed until microscopy proves otherwise (S5). Earlier EPA small-community guidance used SVI above about 200 mL/g as the bulking marker (EPA, 1977). Above 100 mL/g warrants a microscope check, a DO profile, and a wasting review even if the effluent still looks acceptable.
How fast can I fix filamentous bulking?
One to two sludge ages, or roughly 2–3 weeks, if DO, SRT, and nutrients are corrected together. Filaments wash out faster than floc-formers at SRT 5–8 days, so the population shift is the rate-limiting step, not the chemistry (S2, S5).
Can I use chlorine to kill filaments?
Yes, at 0.5–1 mg/L Cl₂ dosed at the head of the aeration basin, but only as a last resort and only with daily microscopy to confirm you are suppressing filaments without sterilizing floc-formers (S2). Chlorine damages the entire population and a misjudged dose can extend the recovery by weeks.
Why is my sludge floating instead of settling?
Denitrification in the clarifier — nitrate-laden flocs enter the clarifier, nitrates convert to nitrogen gas, and the bubbles attach to flocs and lift them. Fix it by adding light aeration to the clarifier to hold 1–2 mg/L DO, increasing wasting to bleed off nitrate-rich solids, and adding an anoxic selector ahead of the aeration basin (S2).
Will switching to MBR eliminate settling problems?
MBR decouples final solid-liquid separation from the activated-sludge biology, so the plant no longer depends on a healthy SVI to meet effluent TSS. The activated-sludge biology upstream still needs proper DO, SRT, and F/M control — MBR solves the separation problem, not the biological imbalance that produced the crisis in the first place.