Smackover, AR Refinery Wastewater: What the 2026 Operator Is Deciding
For a refinery operator in Smackover, AR, the MBR-vs-CAS decision is fundamentally a 40 CFR Part 419 question, not a generic municipal wastewater choice. The historic Smackover Formation remains an active brine and crude-producing play, and the produced-water, desalter brine, sour-water stripper overhead, and tank-bottom streams that come off a southern Arkansas refinery carry high salinity (often 5,000–50,000 mg/L TDS), variable COD/BOD, and recurring oil & grease spikes that punish a conventional activated sludge (CAS) basin. The operator's NPDES permit, issued by Arkansas DEQ under EPA Region 6 oversight, applies one of five 40 CFR Part 419 subparts (Subpart A Topping, Subpart B Cracking, Subpart C Petrochemical, Subpart D Lube, or Subpart E Integrated) depending on refinery configuration, with effluent limits for the eight regulated parameters: BOD5, TSS, COD, oil & grease, phenolic compounds, ammonia, sulfide, and total chromium.
The most current authoritative data source on what real U.S. refinery wastewater looks like is EPA's 2019 Detailed Study of the Petroleum Refining Category (EPA 821-R-19-008), which collected influent and DMR effluent data from 82 refineries. Tables 5-2 and 5-3 of that study show typical refinery influent BOD5 in the 100–300 mg/L range and effluent BOD5 well under 30 mg/L at compliant plants — the baseline the existing CAS basin at a Smackover facility is already designed around. The central question for 2026 capital planning is whether to retrofit the existing CAS basin or install a new MBR train to handle tighter effluent targets, footprint pressure, and any future water-reuse intent.
How Conventional Activated Sludge Treats Refinery Wastewater
A refinery CAS train runs: API oil/water separator → equalization → primary clarification → aeration basin (mixed liquor suspended solids 2,000–4,000 mg/L typical) → secondary clarifier → polishing pond or multimedia filter → NPDES discharge. The activated-sludge biomass in the aeration basin is responsible for the bulk of the dissolved pollutant removal — degrading hydrocarbons, oxidizing ammonia to nitrate, stripping phenols, and reducing sulfide, which together cover seven of the eight Part 419 parameters (chromium is handled by precipitation upstream or in side-stream treatment).
EPA's 2019 Detailed Study lists the BPT end-of-pipe technologies for petroleum refining as activated sludge, aerated lagoons, oxidation ponds, and trickling filters, with effluent polishing via polishing ponds or sand/dual-media/multimedia filters. That list is the regulatory floor: a CAS basin that is well-maintained and preceded by adequate oil/water separation already meets BPT/BAT mass limits when sized for the refinery's feedstock throughput and process configuration factor under 40 CFR 419.
CAS has well-documented weaknesses in refinery service. It is sensitive to oil & grease spikes that coat biomass and cause bulking, sensitive to hydraulic surges from desalter dumps and tank-farm runoff, and recovers slowly from toxic shocks (phenols, sulfides, solvent upsets). The secondary clarifier also dictates a large footprint, and a poorly settling sludge in the clarifier is the single most common reason a refinery CAS basin fails its TSS limit. Adding DAF oil and grease pretreatment ahead of the basin is the standard refinery fix for the first problem; the footprint issue is what pushes operators toward MBR.
How a Membrane Bioreactor Treats Refinery Wastewater
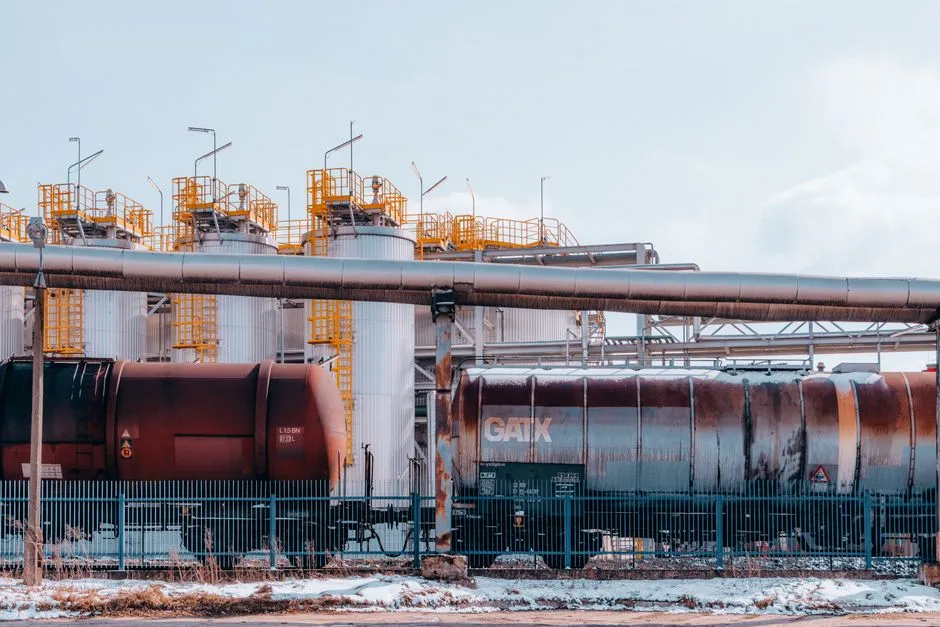
An MBR is an activated-sludge basin in which the secondary clarifier is replaced by submerged PVDF ultrafiltration membranes, typically with a nominal pore size below 1 μm. The biomass does the same biological work as CAS — degrading dissolved hydrocarbons, oxidizing ammonia, and reducing phenols and sulfides — but the solids/liquid separation is done by physical membrane filtration rather than gravity settling. An integrated MBR system with submerged PVDF membrane configured for refinery duty (10–2,000 m³/day, per HydropureWater's MBR product spec) delivers a near-reuse-quality effluent that is essentially free of suspended solids.
Two MBR design features matter for refinery service. First, sludge retention time (SRT) is decoupled from hydraulic retention time, so operators can run SRTs of 20–60+ days versus the 3–15 days typical of CAS. Long SRT lets slow-growing nitrifiers and hydrocarbon-oxidizing bacteria establish a stable population, which directly improves ammonia and phenolic-compound removal — the two Part 419 parameters that most often push a CAS plant toward its limit. Second, the membrane acts as an absolute barrier to biomass washout, so MLSS can be pushed to 8,000–12,000 mg/L, shrinking the aeration basin and eliminating the secondary clarifier entirely.
MBR's energy and operating penalties are real and need to be priced in. Membrane fouling requires chemical cleaning-in-place (CIP) and additional aeration for membrane scouring. IWC 25-20 (Alfa Laval 2025) found that flat-sheet MBR modules with integrated aeration scouring consume 10–20× less energy than external cross-flow systems, but the plant-wide energy bill is still higher than CAS. Mannina et al. (2020) modeled direct GHG emissions at 0.91 kgCO2eq/m³ for MBR versus 0.85 kgCO2eq/m³ for CAS at the same plant load — roughly 7% higher, driven by the extra aeration. The capital side is offset by the footprint: a refinery MBR typically occupies about 60% of the equivalent CAS footprint, which is a decisive advantage on space-constrained Smackover sites. For module-level details on flat-sheet design, see the DF series flat-sheet MBR membrane module specification.
MBR vs CAS Side-by-Side: Parameters, Effluent, and Footprint
The table below summarizes the head-to-head comparison for refinery service. All relative values are normalized to CAS = 100% so the operator can scale the deltas to their own site's design point.
| Parameter | CAS (baseline) | MBR (submerged PVDF UF) | Source |
|---|---|---|---|
| Effluent TSS (mg/L) | 10–30 | <1–5 | HydropureWater MBR spec; EPA 2019 Table 5-3 |
| Effluent BOD5 (mg/L) | 15–30 | <5 | EPA 2019 Table 5-3; HydropureWater MBR spec |
| Effluent COD (mg/L) | 100–200 | 30–80 | EPA 2019 Table 5-3 |
| Oil & grease handling | Sensitive; bulking above ~50 mg/L influent | Tolerant to ~100 mg/L with DAF upstream | Field experience; HydropureWater |
| Ammonia nitrification | Requires SRT > 10 d at 10 °C | Stable at SRT 20–60 d | Mannina et al. 2020 |
| SRT range (days) | 3–15 | 20–60+ | Mannina et al. 2020; HydropureWater |
| HRT (hours) | 6–24 | 4–12 | HydropureWater field data, 2026 |
| Footprint (relative %) | 100% | ~40% (60% smaller) | HydropureWater MBR product data |
| CAPEX (relative %) | 100% | 140–180% | Karim & Mark 2017 (long-term cost crossover > 67 yr) |
| OPEX (relative %) | 100% | 120–140% | Bertanza et al. 2017; HydropureWater field data, 2026 |
| Energy (kWh/m³) | 0.3–0.6 | 0.8–1.6 (refinery MBR) | Mannina et al. 2020; IWC 25-20 |
| Sludge yield | Baseline | Lower observed yield at long SRT | Mannina et al. 2020 |
| Direct GHG (kgCO2eq/m³) | 0.85 | 0.91 | Mannina et al. 2020 |
| Fine-particle barrier (MP/L proxy) | 1.0 | 0.4 | Lares et al. 2018 |
| Resistance to toxic upset | Low (sludge washout risk) | Higher (membrane retains biomass) | Mannina et al. 2020 |
| High-COD stress test (17,000 mg/L COD influent) | Not stable above ~5,000 mg/L | AnMBR: <20 mg/L BOD, <6 mg/L TSS (UF class) | IWC 25-19 (food & beverage, MBR-class effluent) |
The table is deliberately anchored to Mannina et al. 2020 for the GHG and energy numbers (the most recent plant-wide MBR-vs-CAS modeling study in peer-reviewed literature) and to EPA 2019 Tables 5-2/5-3 for the refinery effluent ranges, which are the only data set built from real DMR data across 82 U.S. refineries. Lares et al. 2018 gives the microplastic (MP/L) data that proxies MBR's superior fine-particle barrier — relevant when a refinery permit adds a sheen or particulate limit. The AnMBR IWC 25-19 result (17,000 mg/L COD influent → <20 mg/L BOD, <6 mg/L TSS) is a stress-test proxy showing how stable an MBR-class membrane barrier is at extreme influent load, even though the food & beverage duty differs from refinery duty. For details on what actually fouls an MBR in oil & grease service, see the field data on MBR membrane fouling causes and prevention.
40 CFR Part 419: Do Both Systems Actually Pass?
Both CAS and MBR can meet 40 CFR Part 419 effluent limits when correctly designed — that is the central regulatory fact for the Smackover operator. The PSES/PSNS ceilings that apply across all five subparts are 100 mg/L oil & grease and 100 mg/L ammonia (as N), and the PSNS also limits total chromium to 1 mg/L. The eight regulated parameters (BOD5, TSS, COD, oil & grease, phenolic compounds, ammonia, sulfide, total chromium) are the ones the permit enforces.
| Part 419 Parameter | BPT/BAT (mg/L, max daily at PSES/PSNS) | Typical CAS effluent | Typical MBR effluent | Margin: MBR vs CAS |
|---|---|---|---|---|
| BOD5 | Site-specific (mass-based) | 15–30 | <5 | Wider |
| TSS | Site-specific (mass-based) | 10–30 | <1–5 | Significantly wider |
| COD | Site-specific (mass-based) | 100–200 | 30–80 | Wider |
| Oil & grease | 100 (PSES/PSNS) | 5–15 | <2–5 | Comparable with DAF upstream |
| Phenolic compounds | Site-specific (BAT) | 0.1–0.5 | <0.05–0.2 | Wider at long SRT |
| Ammonia (as N) | 100 (PSES/PSNS) | 5–20 | <1–5 | Wider at long SRT |
| Sulfide | Site-specific | <1 | <1 | Comparable |
| Total chromium | 1 (PSNS) | <0.5 | <0.5 | Same (controlled upstream) |
EPA 2019 Tables 5-2 and 5-3 show that across 82 refineries with DMR data, the average effluent for the eight Part 419 parameters sits well below the BPT/BAT mass limits, which is exactly why most Smackover refineries can demonstrate Part 419 compliance with a well-operated CAS basin today. The pressure to switch to MBR is rarely Part 419 itself; it is the tighter state and local limits on nutrients (nitrogen, phosphorus), TDS, chloride, and trace metals that EPA Region 6 and Arkansas DEQ have been layering on top of the federal ELG since the 2019 Detailed Study. When the limit is a 10 mg/L nitrate-N ceiling or a 500 mg/L TDS ceiling, MBR's tighter effluent margin is what makes compliance achievable without a polishing pond or RO tertiary step.
Decision Framework: When CAS Still Wins in Smackover, When MBR Wins
Below is a refinery-specific weighted scoring matrix a Smackover operator can apply to their own site. Score each criterion 1 (favors CAS) to 5 (favors MBR); sum across all six; if the total is below 12, keep CAS; if it is 18 or higher, install MBR; if 12–17, retrofit MBR ahead of the existing basin as a polishing step.
| Criterion | Weight | Score 1 (CAS favored) | Score 5 (MBR favored) | Your site score |
|---|---|---|---|---|
| Influent variability (COD/BOD swings) | ×2 | Stable (±20%) | Highly variable (>2× swings) | __ |
| Oil & grease load (influent mg/L) | ×3 | <30 with stable separator | >75, frequent spikes | __ |
| Available footprint | ×3 | Adequate brownfield | Constrained, expansion blocked | __ |
| Discharge limits | ×3 | Baseline Part 419 only | Nutrient, TDS, or sheen limits | __ |
| Water-reuse intent | ×2 | None — single-pass discharge | Cooling-tower or boiler-feed reuse | __ |
| OPEX tolerance vs CAPEX | ×1 | CAPEX-constrained, OPEX-tolerant | OPEX-tolerant, CAPEX available | __ |
Plain-English rule for Smackover refineries: if the existing CAS basin is in good structural condition, influent is stable after API separation, and the permit is baseline Part 419 with no nutrient/TDS add-ons, keep CAS and add a polishing pond. Retrofit to MBR only when (a) discharge limits tighten, (b) the site is footprint-constrained, (c) high-salinity produced water is being blended into the influent, or (d) the plant is planning to reuse treated effluent for cooling-tower make-up. In every case, install a DAF oil and grease pretreatment unit (4–300 m³/h) ahead of either system to knock oil & grease below 50 mg/L and protect both the biomass and the membranes. For sites where the existing CAS basin is structurally reusable, an integrated MBR system with submerged PVDF membrane placed downstream of the existing basin — rather than replacing it — gives most of the MBR effluent margin at a fraction of the CAPEX. For sludge handling downstream of either system, a plate and frame filter press for sludge dewatering producing a 25–35% dry cake is the standard refinery fit; for a side-by-side review against belt presses, see the comparison guide on belt filter press vs plate and frame filter press economics. For related industrial MBR-vs-CAS contexts, see also the MBR vs CAS comparison for chemicals wastewater and the MBR vs CAS for high-TDS mining wastewater guides.
Frequently Asked Questions
Can a refinery MBR meet 40 CFR Part 419 BPT/BAT limits?
Yes. A correctly designed MBR with submerged PVDF UF membranes (<1 μm) and SRT of 20–60+ days delivers effluent BOD5 under 5 mg/L, TSS under 5 mg/L, COD under 80 mg/L, oil & grease under 5 mg/L, and ammonia under 5 mg/L — comfortably below the PSES/PSNS ceilings of 100 mg/L oil & grease and 100 mg/L ammonia (as N) and well under the mass-based BPT/BAT limits in Tables 2-3 of 40 CFR Part 419 for any of the five subparts.
Can my existing CAS basin be retrofitted with membranes instead of replaced?
Yes, and for many Smackover refineries this is the lowest-CAPEX path to MBR-class effluent. The existing aeration basin is retained; the secondary clarifier is repurposed as an additional anoxic/aerobic zone or a membrane-tank buffer; and a submerged PVDF UF cassette is installed in a new or converted membrane tank downstream. This approach typically delivers 70–80% of the effluent improvement of a full MBR replacement at 50–60% of the CAPEX, and the existing API separator and primary clarifier are reused unchanged.
What pretreatment does a refinery MBR require?
A DAF unit is the standard refinery pretreatment ahead of an MBR. The DAF knocks oil & grease below 50 mg/L and removes a large fraction of the TSS, which is critical because oil & grease is the single most common cause of MBR membrane fouling. Without DAF, refinery MBRs typically require chemical CIP every 4–8 weeks; with DAF, the cleaning interval stretches to 8–16 weeks and the transmembrane pressure stays in a stable operating band.
How much more energy does an MBR use compared to CAS?
For refinery duty, an MBR uses roughly 0.5–1.0 kWh/m³ more than CAS, with typical MBR energy at 0.8–1.6 kWh/m³ versus 0.3–0.6 kWh/m³ for CAS (Mannina et al. 2020). The energy penalty is dominated by membrane-scouring aeration, which is why flat-sheet modules with integrated coarse-bubble aeration (per IWC 25-20, 2025) are now preferred over external cross-flow designs. Direct GHG emissions run about 7% higher for MBR (0.91 vs 0.85 kgCO2eq/m³ per Mannina et al. 2020).
Who regulates a Smackover refinery's NPDES permit?
Arkansas DEQ is the NPDES permitting authority, with EPA Region 6 providing oversight under the federal 40 CFR Part 419 effluent limitation guidelines for the Petroleum Refining Point Source Category. The 2019 EPA Detailed Study (EPA 821-R-19-008) is the most current authoritative source on what pollutant levels compliant U.S. refineries are actually discharging.