Why Wichita Transportation Equipment Plants Are Re-evaluating Biological Treatment in 2026
EPA 40 CFR 433 metal-finishing categorical pretreatment standards and KDHE surface-water quality standards for the Little Arkansas and Arkansas River basins are tightening the envelope on Wichita transportation parts plants in 2026, and biological treatment is where most of those limits get decided. The local cluster - Spirit AeroSystems and its tier-1 aerospace suppliers, rail and heavy-truck assembly along the I-135/I-35 corridor, automotive component machining, and growing MRO activity at Jabara and McConnell - generates a wastewater profile that punishes both conventional activated sludge and membrane bioreactors in different ways: oil and coolant emulsions from machining, phosphate and alkaline cleaners, hexavalent chromium from conversion coatings, paint overspray washwater, and TDS spikes from chem-milling or heat-treatment rinses. EPA 40 CFR 433 sets daily maximum categorical limits at 2.13 mg/L total chromium, 1.48 mg/L nickel, 1.05 mg/L zinc, 4.14 mg/L copper, and 52 mg/L oil and grease, and Wichita Water Utilities applies local POTW limits on top of that (per EPA 40 CFR 433).
The core trade-off for a process engineer is straightforward. MBR, operating at 8,000-15,000 mg/L MLSS with a 0.1 micrometer PVDF membrane, buys better effluent, a 30-50% smaller tank farm, and a real barrier against bulking, foaming, and high variability. It costs 20-50% more in capex and 30-50% more in energy, plus a membrane replacement cycle every 7-12 years. CAS, at 2,000-4,000 mg/L MLSS with a gravity clarifier, is cheaper to install, simpler to run, but needs more land and almost always a tertiary polishing step to consistently hit KDHE or Wichita reuse targets. For 2026 capital projects in the 50-500 m3/day range, that trade-off is the design basis.
How MBR and Conventional Activated Sludge Actually Work
Both technologies run the same biology - a mixed microbial consortium oxidizing dissolved organics under aerobic conditions. The difference is purely in the solid-liquid separation step, and that single change drives most of the operating and cost consequences a Wichita engineer has to plan around.
Conventional activated sludge uses a rectangular or circular aeration basin at 2,000-4,000 mg/L MLSS, followed by a gravity secondary clarifier. Biomass settles, return activated sludge (RAS) is pumped back to maintain concentration, and waste activated sludge (WAS) is sent to dewatering. Settling is the weak point: bulking sludge, rising sludge, and shock hydraulic loads from intermittent production shifts all knock the clarifier out of spec, and there is no physical barrier between the bugs and the effluent.
A membrane bioreactor runs the same biology but at 8,000-15,000 mg/L MLSS with a much higher solids retention time, and replaces the clarifier with submerged PVDF ultrafiltration membranes - typically 0.1 micrometer pore size in a flat-sheet or hollow-fiber module. The membrane physically retains biomass, bacteria, and most viruses, so settling is irrelevant. MBR also tolerates bulking, foaming, and influent variability far better than CAS, which matters at a transportation plant with shift-based production. The energy penalty is real: MBR continuously scours membranes with coarse-bubble aeration, which is why energy runs 30-50% above CAS in a Wichita full-scale plant (lamella-clarifier.com, 2026). An integrated MBR wastewater treatment system packages both stages in a single skid for plants in the 10-2,000 m3/day range.
One point worth stating plainly for engineers used to designing CAS: MBR is not a different biology. It is CAS biology with a membrane instead of a clarifier, which simplifies pilot design and lets you reuse existing kinetic parameters as a starting point for sizing.
Head-to-Head Performance and Operating Parameters
The table below consolidates the operating envelope a Wichita engineer needs to put into a design basis. Numbers reflect published literature, manufacturer data, and full-scale plant experience; treat them as a defensible starting point for a 200 m3/day line, not a vendor quote.
| Parameter | Conventional Activated Sludge (CAS) | Membrane Bioreactor (MBR) |
|---|---|---|
| MLSS | 2,000-4,000 mg/L | 8,000-15,000 mg/L |
| SRT | 5-15 days | 20-60 days |
| HRT | 6-12 hours | 3-6 hours |
| Effluent TSS | 10-30 mg/L | <1-5 mg/L (sub-1 micrometer) |
| Effluent BOD | 10-20 mg/L | <5 mg/L |
| Effluent COD | 50-100 mg/L | <30 mg/L |
| Total nitrogen removal | 30-60% (without dedicated anoxic) | Up to 79% (full-scale VMBR, per S2) |
| Total phosphorus removal | 20-40% (chemical) | Up to 90% (full-scale VMBR, per S2) |
| Sludge yield | 0.4-0.6 kg TSS/kg BOD removed | 0.2-0.35 kg TSS/kg BOD removed |
| Energy demand | 0.3-0.6 kWh/m3 | 0.7-1.2 kWh/m3 (full-scale average 0.94 kWh/m3, per S2) |
| Capex delta vs CAS | Baseline | +20-50% |
| Opex delta vs CAS | Baseline | +30-50% energy; -20-40% sludge handling |
| Footprint | Baseline (larger due to clarifier and tertiary) | -30-50% vs CAS |
| Membrane replacement | N/A | Every 7-12 years |
| Tolerance to FOG / oil | Poor without upstream DAF | Moderate; requires DAF for >50 mg/L O&G (40 CFR 433) |
| Direct GHG emissions | 0.85 kgCO2eq/m3 (Mannina et al., benchmark) | 0.91 kgCO2eq/m3 (Mannina et al., benchmark) |
| Microplastics in effluent | ~1 MP/L (Lares et al., 2018) | ~0.4 MP/L (Lares et al., 2018) |
Three data points deserve a callout because they shift the buyer's framing. First, the GHG penalty of MBR is small - 0.91 vs 0.85 kgCO2eq/m3 in the Mannina plant-wide benchmark - meaning the energy narrative is real but the carbon narrative is largely overstated (Mannina et al.). Second, a real full-scale vertical MBR achieved 79% TN removal, 90% TP removal, and 0.94 kWh/m3, which is a defensible benchmark to put in front of a Wichita controller (per S2). Third, MBR effluent carried roughly 0.4 microplastics/L versus 1 MP/L for CAS in the Lares study, and microplastic scrutiny is a growing line item in 2026 Kansas discharge reviews (Lares et al., 2018). For a plant running 0.1 micrometer PVDF flat-sheet modules, a DF series PVDF flat sheet MBR module is a reasonable reference for energy and footprint sizing (80-225 m2 per module, 32-135 m3/day per module, and 10-20x lower energy than external cross-flow designs per manufacturer data).
Wichita Costs, Footprint and Compliance in 2026 Dollars
For a 50-500 m3/day biological train in Wichita, order-of-magnitude total installed cost for a CAS system runs roughly $1,500-3,000 per m3/day of capacity, with MBR running 20-50% above that. A 200 m3/day MBR train therefore lands in the $360,000-900,000 installed envelope depending on civil work, redundancy, and pretreatment scope. The MBR capex delta is partially offset because MBR eliminates the secondary clarifier and, in most reuse-grade designs, the tertiary sand filter - a meaningful saving on a brownfield site where concrete and excavation dominate.
Opex in 2026 Kansas industrial electricity (Evergy industrial rates around $0.08-0.10/kWh) puts the energy delta at roughly $0.05-0.12 per m3 treated in MBR's favor of CAS on the energy side, with the largest swing coming from membrane scour aeration. Membrane replacement at the 7-12 year interval, amortized across the cycle, typically adds $0.03-0.08 per m3. Against that, MBR cuts sludge handling cost by 20-40% because of the lower observed yield (per S3). On a 200 m3/day line, that is a real number - roughly $15,000-40,000 per year in avoided hauling and dewatering, depending on local biosolids disposal rates.
| Cost / Compliance Lever (200 m3/day, Wichita, 2026) | CAS | MBR |
|---|---|---|
| Total installed cost (biological train only) | $300,000-600,000 | $360,000-900,000 |
| Civil / footprint area required | ~1.4-1.7x MBR area | 30-50% smaller than CAS |
| Energy cost (@ $0.09/kWh) | ~$5,200-10,400/yr | ~$12,000-21,000/yr |
| Membrane replacement (amortized) | N/A | $0.03-0.08/m3 |
| Sludge handling | Baseline | -20-40% vs CAS |
| Effluent polishing needed for reuse | Tertiary filter usually required | Typically reuse-ready without polishing |
| 40 CFR 433 O&G compliance (52 mg/L daily max) | Upstream DAF typically required | Upstream DAF system typically required |
Footprint is often the deciding factor on a brownfield Wichita expansion. A 200 m3/day MBR train typically fits in a standard equipment pad where an equivalent CAS train would need 1.4-1.7x the area for the aeration basin, clarifier, and RAS/WAS pump gallery. CAS effluent at 10-30 mg/L TSS usually needs a polishing step to consistently meet KDHE surface-water TSS or Wichita Water Utilities reuse goals; MBR effluent at sub-1 micrometer turbidity is typically reuse-ready without it. For transportation equipment plants subject to 40 CFR 433, the 52 mg/L daily-max oil and grease limit almost always forces an upstream DAF regardless of which biological train is chosen downstream.
When CAS Is Still the Right Answer (and When MBR Is)
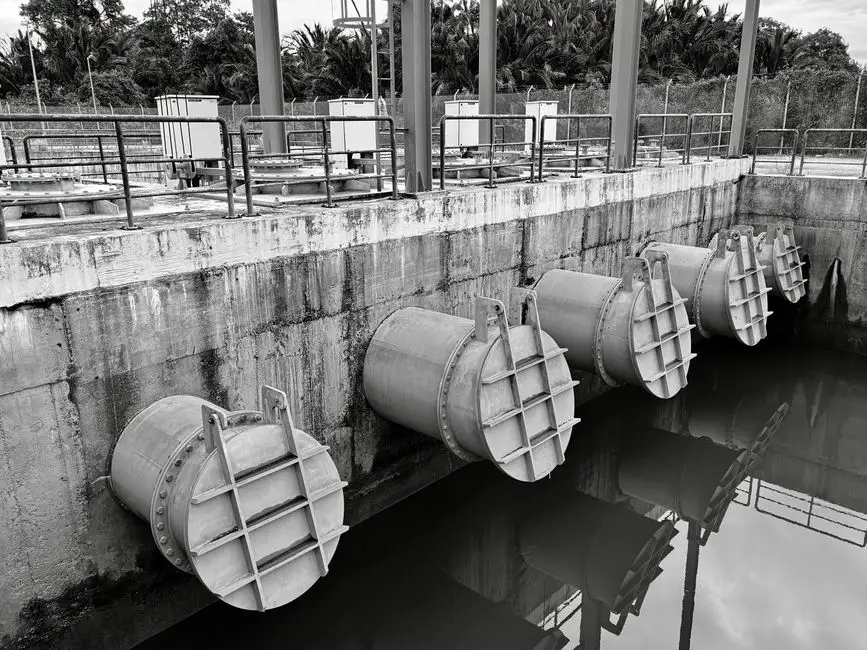
CAS is the right call when land is available and inexpensive, influent is stable and close to municipal-strength, the discharge goes to a Wichita Water Utilities POTW with relaxed limits, and there is no on-site reuse mandate. It is also the right call for an existing CAS basin that has 15-20 years of useful life left - retrofitting a clarifier is far cheaper than a full MBR conversion.
MBR is the right call when effluent reuse is required (toilet flush, cooling tower makeup, process rinse water), when the site is footprint-constrained - which is the norm on a brownfield Wichita expansion - when influent is variable or carries high oil and grease, or when the plant needs a hard barrier against metals exceedance and microplastic scrutiny. MBR is also the right call when the operator skill set cannot reliably run a clarifier through bulking events. A common 2026 Wichita retrofit path keeps the existing CAS basins and adds a sidestream or full-train membrane step, which is a valid cost compromise that should be on the table for any project with functioning civil work already in place.
A Simple Decision Framework for Specifying in 2026
Use this four-step logic to choose the technology and defend it to procurement or leadership.
- Check the discharge or reuse target. If reuse is required, or if effluent TSS must be reliably below ~10 mg/L, MBR is the default. CAS at 10-30 mg/L TSS will need tertiary polishing that often wipes out the capex savings.
- Check the available footprint. If the brownfield site cannot accommodate ~1.5x the MBR footprint in CAS civil work, MBR wins on land alone. This is the most common reason Wichita plants move to MBR.
- Check influent variability and oil and grease load. If the plant has shift-based production, batch discharges, or oil and grease above 50 mg/L, MBR with an upstream DAF is the lower-risk path. CAS will struggle with bulking and oil slug events.
- If none of the above applies, CAS remains the lowest-capex option in 2026. It is mature, well-understood, and cheap to operate where it fits.
For any project in the 50-500 m3/day range, a one-day jar test plus a short MBR pilot on real wastewater remains the safest path before committing capex. Pilot data also gives operators the operating envelope they will live with for the next 15 years.
Frequently Asked Questions
MBR vs CAS for transportation wastewater in Wichita - which is better in 2026?
For most Wichita transportation equipment plants in 2026, MBR is the better default where reuse is required, footprint is constrained, or influent is variable - it delivers <1-5 mg/L effluent TSS, cuts footprint 30-50%, and tolerates bulking and oil events. CAS remains the right call where land is available, discharge goes to a POTW with relaxed limits, and reuse is not on the table. For broader context on how the segment is moving, the 2026 MBR market data confirms continued adoption in industrial reuse applications.
How much does an MBR system cost versus CAS for a 200 m3/day plant in Wichita?
A 200 m3/day CAS biological train in Wichita installs at roughly $300,000-600,000 in 2026 dollars; an equivalent MBR runs 20-50% higher at $360,000-900,000, with the delta largely recovered by eliminating the secondary clarifier and tertiary sand filter. Operating cost runs 30-50% higher in energy for MBR, partially offset by 20-40% lower sludge handling cost and a 7-12 year membrane replacement cycle.
Can MBR handle oily machining wastewater from a transportation parts plant?
MBR can handle oily streams, but not without protection. EPA 40 CFR 433 caps oil and grease at 52 mg/L daily maximum, so an upstream DAF is essentially mandatory for transportation plants machining parts or running conversion coatings. With DAF in front, an MBR running 0.1 micrometer PVDF membranes tolerates the residual emulsified oil and the variable loads far better than a clarifier-based CAS train.
Does MBR meet EPA 40 CFR 433 metal finishing limits without tertiary treatment?
MBR reliably meets the TSS and BOD side of 40 CFR 433 without tertiary polishing, but the metals limits - 2.13 mg/L Cr, 1.48 mg/L Ni, 1.05 mg/L Zn, 4.14 mg/L Cu - are controlled upstream by hydroxide precipitation or ion exchange, not by the biological stage. MBR's contribution is consistent low-TSS effluent that does not carry precipitated metal hydroxides out of the clarifier; the actual metals removal happens in the precipitation step before the bioreactor. For plants in the EV and auto sector, the same pretreatment logic is documented in how EV and auto plants meet 2026 pretreatment limits.
How often do MBR membranes need replacement and what is the typical membrane life?
Modern submerged PVDF flat-sheet MBR membranes in industrial service typically run 7-12 years before replacement, depending on feed quality, cleaning discipline, and operating flux. Discipline matters: plants that skip relaxation cycles, run at sustained high flux, or feed the membranes with untreated oil and grease see shorter life. A useful plant-to-plant benchmark for plastics and rubber operations is covered in the MBR vs CAS engineering guide for plastics and rubber wastewater.