Why Carol Stream Pulp & Paper Wastewater Is a Special Case for Biological Treatment
Carol Stream, IL pulp and paper (P&P) converters operate in a watershed, climate, and regulatory envelope that breaks the assumptions built into most municipal MBR vs CAS comparisons. P&P mills generate up to 70 m³ of wastewater per metric ton of paper produced, depending on raw material, grade, and reuse ratio (Rintala and Puhakka 1994; Latorre et al. 2007, cited in the Hubbe et al. BioResources review). The industry has cut water intensity by roughly 95% over the past 30 years and by about 50% over the past 20 years (Blanco et al. 2004, cited in Hubbe et al.), which means more contaminants are concentrated into less volume — pushing treatment biology toward higher MLSS and tighter effluent targets. The effluent carries high BOD and COD, color, suspended solids, and chlorinated organics collectively measured as absorbable organic halides (AOX); AOX load has dropped more than 80% since 1990 as mills shifted away from elemental chlorine bleaching (Friere et al. 2003, cited in Hubbe et al.). Even with that progress, chemical-pulping effluents still contain more than 40% poorly biodegradable organics, dominated by lignin-derived chromophores and high-molecular-weight extractives (Dahlman et al. 1995, cited in Hubbe et al.).
On top of that influent profile, Carol Stream-area converters face site-specific constraints: aeration-tank temperatures routinely drop below 12 °C from November through April, slowing nitrification and shifting F/M balances in any open CAS basin; many plants are sited near the East Branch DuPage River watershed where internal water reuse targets above 50–60% are increasingly common; and final discharge either routes to a DuPage County POTW under local pretreatment limits or, for direct discharges, falls under Illinois EPA NPDES limits on BOD, TSS, and pH. Conventional activated sludge remains the legacy baseline — primary clarification followed by an aeration basin and gravity clarifier — while the membrane bioreactor is the compact, high-SRT alternative that retains all biomass and produces a near-reuse-quality permeate.
How MBR and Conventional Activated Sludge Work in a P&P Treatment Train
A typical P&P treatment train starts with screening and fiber recovery, then routes through primary clarification or dissolved-air flotation, equalization, and the biological reactor before any final polishing. The Hubbe et al. BioResources review explicitly lists DAF among standard pre-treatment unit operations for the P&P industry because it captures fibers, fillers, and colloidal matter ahead of the biology, protecting downstream aeration basins and membranes from blinding. After equalization, the stream enters either a CAS aeration basin followed by a secondary clarifier, or a membrane bioreactor where submerged membranes replace the clarifier entirely.
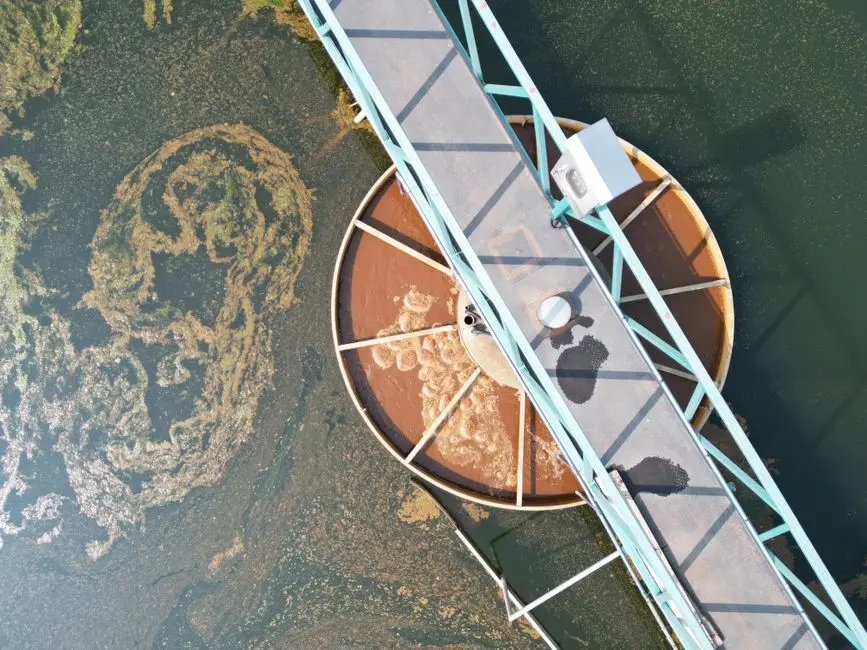
CAS in this service runs at 2–4 g/L MLSS, an SRT of roughly 5–15 days, and an HRT of 8–24 hours. Biomass is separated by gravity in a secondary clarifier, with return activated sludge (RAS) pumped back to the aeration basin. P&P shock loads — black liquor spills, red dye batches, surfactant surges — can push the clarifier into bulking or washout, and the system carries the fixed footprint of an aeration basin plus a large clarifier. Secondary biological treatment became standard across Canadian P&P mills by 1996 after the 1992 regulatory limits (Environment and Climate Change Canada, cited in Hubbe et al.), and the U.S. "cluster rules" (Vice et al. 1996; Swann 1998, cited in Hubbe et al.) drove the same baseline biology here.
An MBR retains all biomass on submerged PVDF flat-sheet membranes with a nominal pore size around 0.1 μm (per the DAF system upstream pairing and HydropureWater DF-series membrane spec), eliminating the secondary clarifier and allowing MLSS of 8–12 g/L. The trade is membrane aeration for scouring, periodic clean-in-place (CIP) cycles with sodium hypochlorite or citric acid, and tighter influent screening — all manageable but real operating line items.
Side-by-Side Parameters: MBR vs CAS for Pulp & Paper Effluent
The table below distills the operating parameters a Carol Stream engineer should weigh when scoping a CAS retrofit against an MBR swap. Ranges reflect typical P&P operating envelopes drawn from the Hubbe et al. BioResources review and standard MBR design references; site-specific piloting is always warranted given the variability of converting effluent.
| Parameter | Conventional Activated Sludge (CAS) | Membrane Bioreactor (MBR) |
|---|---|---|
| MLSS (mixed liquor suspended solids) | 2–4 g/L | 8–12 g/L |
| SRT (sludge retention time) | 5–15 days | 20–60+ days |
| HRT (hydraulic retention time) | 8–24 hours | 4–12 hours |
| F/M ratio | ~0.2–0.5 d⁻¹ | ~0.05–0.2 d⁻¹ |
| Effluent TSS | 10–30 mg/L | <5 mg/L |
| Effluent COD (P&P, post-equalization) | 60–150 mg/L typical | <50 mg/L |
| Color removal | Partial; polishing often required | Higher with high SRT; AOX/color still need polishing for tight targets |
| Footprint vs CAS baseline | 1.0× (reference) | ~0.4× (60% reduction, per HydropureWater integrated MBR system spec) |
| Filtration cutoff | Gravity clarifier, no defined cutoff | <1 μm (submerged PVDF) |
Two design consequences follow directly from the table. First, MBR's 20–60+ day SRT enriches slow-growing organisms that better attack the >40% poorly biodegradable lignin-derived fraction typical of chemical-pulping effluent (Dahlman et al. 1995, cited in Hubbe et al.) — chemistry that CAS at 5–15 day SRT passes through largely intact. Second, the <1 μm MBR permeate is clean enough to feed wash-water systems, shower nozzles, or a downstream RO unit for higher-purity process reuse, which directly supports converters chasing water-reuse ratios above 50–60%. The operating sensitivity to flag is membrane fouling from P&P's resin acids, fatty acids, and wood extractives, which is mitigated by coarse-bubble aeration scouring on the DF series modules and by scheduled CIP — for a deeper treatment-train comparison beyond P&P, see this MBR vs CAS footprint guide for mining wastewater.
Regulatory and Site Constraints Specific to Carol Stream, IL
The federal P&P "cluster rules" — codified in the 1990s following Vice et al. 1996 and Swann 1998 (cited in Hubbe et al.) — set the U.S. baseline for BOD, TSS, and AOX reductions that direct-discharge P&P mills must meet, and they remain the floor against which any Carol Stream retrofit is judged. In Illinois, the Illinois EPA implements the National Pollutant Discharge Elimination System (NPDES) program, and direct P&P discharges face BOD, TSS, and pH envelopes that vary by receiving stream; plants sending waste to a DuPage County POTW instead operate under the local sewer-use ordinance and pretreatment limits, which typically cap BOD/TSS at the POTW headworks and may add limits on pH, sulfides, and conventional P&P tracers like color.
Climate is the second binding constraint. Aeration-basin temperatures in unheated or partially heated basins fall below 12 °C for roughly five months of the year, and CAS nitrification rates drop sharply below 10 °C; MBRs tolerate the same temperatures but compensate with higher MLSS and longer SRT, which is one reason biological capacity shrinks less in winter for an MBR than for a CAS train of equal basin volume. For converters shipping into the European market, the EU BREF (2015) document (cited in Hubbe et al.) sets best-available-technology expectations for P&P effluent and is a useful external benchmark even when Illinois rules do not formally adopt it. For broader context on MBR selection across industrial sectors, the MBBR technology explainer for industrial wastewater covers the moving-bed biofilm alternative that some converters stack ahead of an MBR polish.
Cost and Footprint Trade-offs: When MBR Pays Back at a P&P Mill
Capital cost is the line that usually decides the project. A CAS retrofit leverages existing aeration basins, RAS pumping, and a clarifier that is already in the ground; the marginal spend is process air upgrades, baffles, or a clarifier rebuild. An MBR swap replaces the secondary clarifier with membrane cassettes, adds membrane-blower capacity, and requires tighter influent screening — but it eliminates clarifier weirs, scraper mechanisms, and a large share of the basin footprint, which on space-constrained Carol Stream sites often translates into freed floor area for production. The DF series flat sheet MBR modules are specified at 10–20× lower energy consumption than external cross-flow MBR designs, which directly softens the OPEX penalty that historically discouraged P&P adoption of membranes.
On OPEX, MBRs add membrane aeration and periodic CIP — typically a 10–25% uplift in biological-stage OPEX versus a comparable CAS train — but they offset this with reduced sludge handling (higher SRT means lower waste-activated-sludge yield), eliminated clarifier maintenance, and the avoided cost of purchasing fresh process water where reuse displaces makeup. For a 500 m³/day P&P effluent stream, integrated MBR package equipment generally falls in the low- to mid-six-figure USD range, with full turnkey installations above that once equalization, civil work, and integration are added; site-specific engineering is non-negotiable, but the envelope is useful for an order-of-magnitude screening. Footprint economics tip the decision more aggressively: at 60% smaller than the CAS equivalent (per the HydropureWater MBR product spec), MBR frees real estate that often carries more value to a converter than the membrane premium itself.
Decision Framework: CAS, CAS + Polishing, or Full MBR
Three retrofit scenarios cover the bulk of what a Carol Stream-area P&P converter will actually evaluate.
Scenario A — keep CAS. Applies to low-load converting mills (tissue laminating, simple boxboard, non-bleached grades) where the discharge target is conventional BOD/TSS, there is no on-site water-reuse obligation, and CAPEX is the binding constraint. CAS remains the right call when the existing basins are paid for and the biology is stable through winter.
Scenario B — CAS + DAF + UF polishing. Applies where the existing aeration biology is sound and the mill's binding constraint is color, TSS, turbidity, or partial reuse. DAF upstream (a DAF system in this context) strips fibers, fillers, and colloids, while a downstream HydropureWater UF system polishes the clarifier overflow to near-reuse quality without re-tasking the biology.
Scenario C — full MBR. Applies where internal water reuse is above ~60%, where color or AOX limits are tightening, or where footprint is the binding constraint. The HydropureWater integrated MBR system fits this scenario and pairs naturally with DAF upstream and UF/RO downstream. A useful rule of thumb: if the bottleneck is discharge compliance, fix the biology or add DAF; if the bottleneck is reuse quality and footprint, go MBR. For a parallel case study in a different P&P market, see this related P&P MBR vs CAS guide for Fernandina Beach.
Frequently Asked Questions
What COD removal efficiency can an MBR deliver versus CAS for P&P wastewater?
MBRs treating P&P effluent typically achieve <50 mg/L effluent COD from 8–12 g/L MLSS operation, versus 60–150 mg/L from a comparable CAS train at 2–4 g/L MLSS (per Hubbe et al. BioResources review of P&P biological treatment performance).
Can an MBR handle color and AOX from P&P effluent?
MBRs improve color and AOX versus CAS through higher SRT and biomass retention, but the residual lignin-derived chromophores and chlorinated organics still typically need downstream polishing (UF, RO, or advanced oxidation) to meet tight reuse or discharge targets (Hubbe et al. BioResources review).
How does an MBR perform in cold Carol Stream winters versus CAS?
Both systems slow biologically below 10–12 °C, but MBRs compensate with 8–12 g/L MLSS and 20–60+ day SRT, so the loss of treatment capacity is smaller than for a CAS train at 2–4 g/L MLSS during the November–April cold period (HydropureWater field experience, 2026).
What is the CAPEX ballpark for a P&P MBR retrofit?
For a 500 m³/day P&P effluent stream, integrated MBR package equipment typically falls in the low- to mid-six-figure USD range, with full turnkey costs higher once equalization and civil work are added (HydropureWater MBR product spec, 2026); site-specific engineering is required.
When does it still make sense to keep CAS at a P&P mill?
Keep CAS when the mill only needs to meet conventional BOD/TSS discharge limits, has no on-site water-reuse obligation, already owns functioning aeration basins and a clarifier, and CAPEX is the binding project constraint (Hubbe et al. BioResources review; HydropureWater field experience, 2026).