Why Fernandina Beach Pulp & Paper Wastewater Is a Special Case
Pulp and paper (P&P) effluent volumes are extreme by municipal standards: up to 70 m³ of wastewater per metric ton of paper produced, with chemical pulping streams carrying more than 40% poorly biodegradable organics in their total COD load (Hubbe et al. 2016, citing Rintala & Puhakka 1994; Latorre et al. 2007; Dahlman et al. 1995). That organic fraction is dominated by lignin fragments, chlorinated derivatives, and wood extractives — species that resist short-SRT biology and drive color bodies and AOX. A generic "MBR vs CAS" answer built on municipal sewage characteristics (cool temperature, low color, biodegradable BOD) misleads the engineer because P&P streams typically sit at 35–55 °C from pulping and drying, 1,000–5,000 mg/L COD, BOD₅/COD ratios of 0.2–0.4 (low biodegradability), and 500–2,000 Pt-Co color units, with AOX emissions reduced by over 80% since 1990 but still regulated (Hubbe et al. 2016, citing Savant et al. 2006; Friere et al. 2003).
Receiving-water context tightens the case further. Fernandina Beach mills sit on Amelia Island and discharge toward Nassau Sound and the Atlantic Intracoastal Waterway — a tidal estuarine system with salinity-intolerant SAV beds, shellfish harvesting waters, and Florida DEP antidegradation expectations. The domestic compliance anchor is the US "Cluster Rules" for P&P (Hubbe et al. 2016, citing Vice et al. 1996; Swann 1998; Vice & Carroll 1998), and the 2026 EU BREF update for P&P is tightening several Best Available Technique Associated Emission Levels (BAT-AELs) that any US mill exporting to European converters should treat as a forward-looking benchmark. For a full read of the 2026 US compliance picture, see the 2026 EPA wastewater compliance guide.
How Conventional Activated Sludge Treats Pulp & Paper Effluent
The CAS train most P&P engineers know is a primary clarifier followed by an aeration basin operating at mixed liquor suspended solids (MLSS) of roughly 2,500–4,000 mg/L, then a secondary settling tank, and often a tertiary polishing step (Mannina et al. 2020, paraphrasing the standard CAS description: pollutant degradation by bacterial and protozoan growth, floc aggregation, then solid/liquid separation in a settling tank). Solids retention time typically runs 5–15 days and hydraulic retention time 6–12 hours, depending on the oxygen-transfer capacity of the basin and the temperature window — and temperature in P&P is the variable that pushes CAS to its limits.
Three P&P-specific failure modes recur in operating data. First, poorly settling sludge from high lignin and extractive loads collapses the secondary clarifier; bulking species proliferate when the basin runs above 35 °C through a Northeast Florida summer. Second, large clarifier footprints — multiple hectares for a 10,000 m³/day mill — consume coastal real estate that Fernandina Beach sites cannot spare. Third, short SRT starves the slow-growing populations that would otherwise begin to break down chlorinated lignin derivatives. The economic picture is favourable in the short term: Karim & Mark (2017) and Bertanza et al. (2017), both cited in Mannina et al. (2020), find that CAS remains the most economic option over short payback horizons and beats MBR on operating cost, with a benchmark direct GHG footprint of about 0.85 kgCO₂eq/m³ — a number that frames the carbon question for the rest of this article.
How a Membrane Bioreactor Handles the Same Load
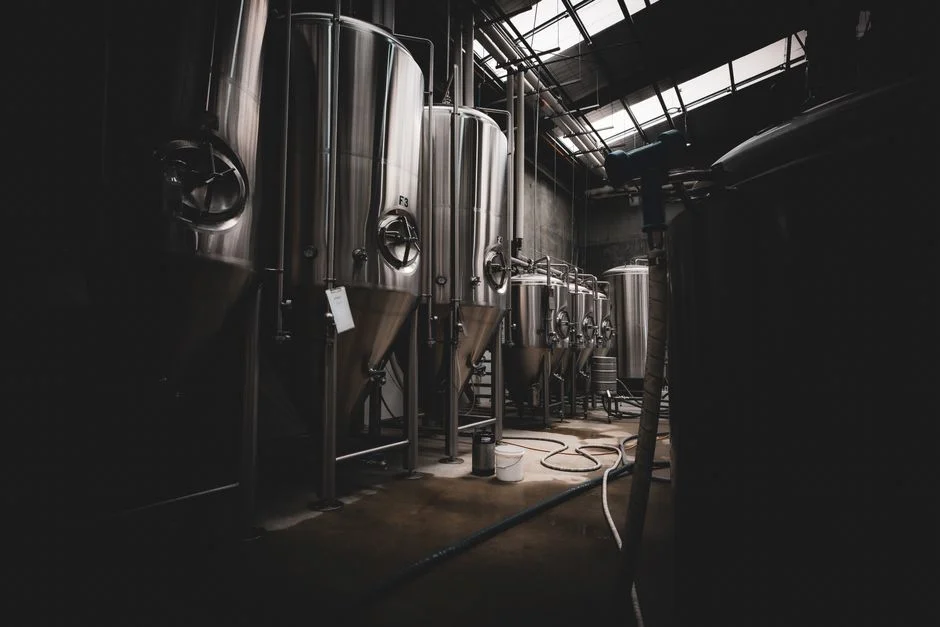
A submerged MBR takes the same activated-sludge biology as CAS and runs it in an aeration basin fitted with PVDF hollow-fiber or flat-sheet cassettes, typically 0.1 µm nominal pore size, that physically replace the secondary clarifier. The mixed liquor operates at 8,000–12,000 mg/L MLSS, SRT extends to 20–60 days, and HRT compresses to 4–8 hours. Effluent leaves the membranes at sub-1 µm clarity — typically <1 mg/L TSS and turbidity below 0.5 NTU in steady operation. A compact example is the HydropureWater integrated MBR system, with replacement modules such as the DF series PVDF flat-sheet MBR modules for capacity expansion.
Mannina et al. (2020) name four MBR advantages: (i) higher SRT than CAS, which lets the basin degrade recalcitrant pollutants; (ii) lower observed cell yield, hence less waste activated sludge; (iii) very high effluent quality from physical solid/liquid separation; and (iv) significant footprint reduction because the membrane cassette replaces the clarifier (citing Ma et al. 2018). The two named disadvantages matter for P&P: (i) membrane fouling, which reduces permeate flux or raises transmembrane pressure; and (ii) the energy cost of fouling mitigation via coarse-bubble aeration scouring and periodic chemical cleans (citing Judd 2016; Xiao et al. 2019). The SRT advantage is exactly the lever a P&P mill needs: longer SRT sustains slow-growing organisms capable of partial degradation of chlorinated lignin derivatives and residual AOX that short-SRT CAS cannot reach, even though the bulk of AOX removal still depends on upstream bleaching-sequence changes rather than the biological stage alone.
MBR vs CAS for Pulp & Paper: Parameter-by-Parameter Comparison
The table below anchors the MBR figures to the Mannina et al. (2020) plant-wide model and the Hubbe et al. (2016) P&P review; CAS and MBR columns are drawn from the same sources where available, with typical P&P design ranges called out where the source data is municipal. Engineers should treat any cell without a primary citation as a design range to verify with a mill-specific pilot or jar test — not a guaranteed number.
| Parameter | CAS (P&P design range) | Submerged MBR (P&P design range) | Source / note |
|---|---|---|---|
| Sludge retention time (SRT), days | 5–15 | 20–60 | Mannina et al. 2020 (MBR higher); Karim & Mark 2017 cited therein |
| MLSS, mg/L | 2,500–4,000 | 8,000–12,000 | Standard P&P design range; verify with jar test for given furnish |
| HRT, hours | 6–12 | 4–8 | Mannina et al. 2020 (footprint reduction); Ma et al. 2018 cited therein |
| Footprint vs CAS baseline | 1.0× (reference) | ~0.4× (≈60% smaller) | Mannina et al. 2020; HydropureWater integrated MBR system spec |
| Effluent TSS, mg/L | 10–30 (clarifier-dependent) | <1 (membrane) | Hubbe et al. 2016 review; MBR spec |
| Effluent COD, mg/L | 200–400 typical, with tertiary <150 | 50–150 typical | Hubbe et al. 2016; Mannina et al. 2020 |
| Effluent turbidity, NTU | 2–10 (clarifier-dependent) | <0.5 | Standard MBR operating envelope |
| Color removal, % | 40–70 (biological only) | 50–75 (biological only) | Both limited without tertiary — see compliance section |
| AOX residual vs influent | Modest reduction; matrix-dependent | Better reduction via high SRT; still requires upstream bleaching controls | Hubbe et al. 2016; Savant et al. 2006 cited therein |
| Energy demand, kWh/m³ | 0.3–0.6 (P&P range) | 0.6–1.2 (membrane scouring dominates) | Mannina et al. 2020; Bertanza et al. 2017 cited therein |
| Membrane fouling / cleaning burden | None | Chemical cleans every 1–6 months; periodic recovery cleans | Judd 2016; Xiao et al. 2019 cited in Mannina et al. 2020 |
| Direct GHG, kgCO₂eq/m³ | 0.85 | 0.91 | Mannina et al. 2020 benchmark scenario (essentially a wash) |
| Microplastics in effluent, MP/L | ~1.0 | ~0.4 | Lares et al. 2018 cited in Mannina et al. 2020 — relevant for reuse discussions |
| CAPEX, indexed | Lower (no membrane cassettes) | Higher (cassettes, scour blowers, CIP) | Karim & Mark 2017; Bertanza et al. 2017 cited in Mannina et al. 2020 |
| OPEX, indexed | Lower | Higher (energy + membrane replacement + chemicals) | Bertanza et al. 2017 cited in Mannina et al. 2020 |
Compliance Fit for Fernandina Beach Discharges
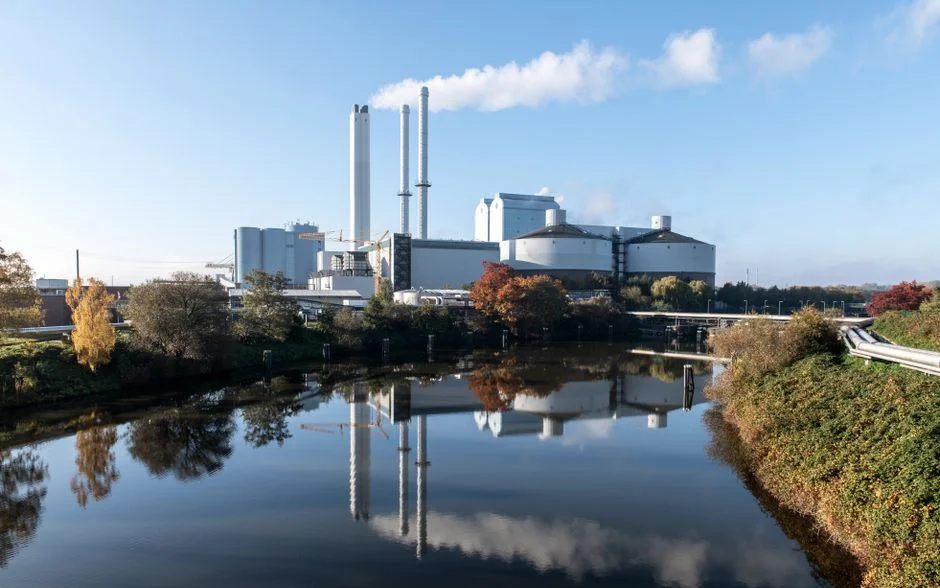
The US Cluster Rule (Hubbe et al. 2016, citing Vice et al. 1996; Swann 1998) anchors federal P&P effluent expectations around BOD, TSS, AOX, chlorinated dioxins and furans, and defoamer controls. Florida DEP industrial wastewater permitting for major P&P discharges typically requires monthly-average TSS < 30 mg/L and BOD < 30 mg/L at the outfall, with chronic toxicity and whole-effluent toxicity (WET) tests on the menu. Both CAS and MBR can clear TSS and BOD in a well-run plant, but MBR is the technology that clears the bar on a Friday afternoon in August when the secondary clarifier is upset by bulking sludge. Color and AOX are a different question: the biological stage in either configuration will not, on its own, hit color targets for a bleaching mill. A tertiary step — coagulation/DAF or advanced oxidation (ozone/UV, Fenton) per the Hermosilla et al. (2015) review cited in Hubbe et al. 2016 — is still required regardless of which biological stage the mill selects.
The table below translates the regulatory language into what each technology actually clears.
| Permit metric (typical Florida DEP major discharge) | CAS (with good clarifier performance) | Submerged MBR | Notes |
|---|---|---|---|
| TSS, mg/L monthly avg < 30 | Often meets; sensitive to clarifier upsets | Comfortably meets (< 5 typical) | MBR has the larger compliance margin |
| BOD, mg/L monthly avg < 30 | Meets with adequate SRT | Comfortably meets | Both adequate when biology is healthy |
| Color (Pt-Co) | 50–70% removal; tertiary usually required | 50–75% removal; tertiary usually required | Biological stage alone is rarely enough |
| AOX, kg/ADt | Modest biological reduction | Better reduction at high SRT, but bulk of AOX is upstream-controlled | Bleach sequence changes drive AOX, not the biological stage |
| Whole effluent toxicity (WET) | Passes with adequate biotreatment | Passes; tighter effluent reduces false positives | Both meet; MBR less variable |
| Reuse suitability (industrial process water) | Needs UF/RO polish | Sub-1 NTU filtrate is reuse-ready for many uses | MBR cuts downstream polishing cost |
For mills that need a tertiary step either way, a DAF system ahead of the biological stage, or advanced oxidation downstream, slots into either train. The 2026 EU BREF for P&P is tightening several BAT-AEL ranges — US mills with European converter customers, or mills pursuing ESG parity, should plan for similar tightening in the next Cluster Rule revision cycle.
Cost, Energy, and Carbon Trade-Offs in 2026
The honest answer to "which is cheaper" depends on horizon. Mannina et al. (2020) confirm that MBR has higher energy demand than CAS, driven by coarse-bubble aeration for membrane scouring. Bertanza et al. (2017), cited in Mannina et al. (2020), found that CAS wins on cost while MBR wins on environmental and social metrics in a triple-bottom-line assessment. Karim & Mark (2017), also cited in Mannina et al. (2020), found that MBR becomes the most cost-effective option only when the analysis horizon stretches beyond roughly 67 years — a horizon that is academic for any P&P retrofit, so on pure 25-year NPV CAS still wins. The Mannina et al. (2020) plant-wide benchmark puts direct GHG at 0.85 kgCO₂eq/m³ for CAS and 0.91 kgCO₂eq/m³ for MBR — a difference inside the model uncertainty band, so direct carbon is essentially a wash.
That makes the real carbon story indirect: in-plant water reuse displacement credits (MBR sub-1 NTU filtrate can feed cooling-water or wash-water loops) and avoided hauling of thickened waste activated sludge. The sludge line still needs dewatering in either configuration, and a HydropureWater plate and frame filter press handles waste activated sludge from both CAS and MBR trains to a 22–28% dry cake typical of P&P biosolids. Work the OPEX comparison as energy + membrane replacement + chemical cleans (MBR) versus aeration + clarifier maintenance + polymer (CAS), and amortize the CAPEX delta against any avoided tertiary polish step.
Decision Framework: When to Choose MBR, When to Keep CAS
Apply this four-question test before opening the CAPEX memo:
- Is the site land-constrained? Coastal Fernandina Beach lots are small and expensive. If a 60% footprint reduction unlocks buildable land for storage or expansion, MBR earns its premium. A retrofit that drops submerged cassettes into the existing aeration basin after the secondary clarifier is repurposed is technically feasible, but a hydraulic and blower audit is mandatory before any commitment.
- Is the mill targeting in-plant water reuse? MBR sub-1 NTU filtrate can feed wash-water or cooling loops directly; CAS effluent needs a UF polish — a configuration captured in our HydropureWater hollow-fiber UF system product line. For sites planning direct or indirect potable reuse, MBR is the 2026 default.
- Does the discharge go to a sensitive tidal water? Nassau Sound and the Atlantic Intracoastal have tight Florida DEP antidegradation expectations and salinity-intolerant biota. The compliance margin MBR delivers on TSS, turbidity, and microplastics (0.4 vs 1.0 MP/L per Lares et al. 2018, cited in Mannina et al. 2020) is worth the energy premium.
- Does OPEX dominate the business case? If the existing aeration basin and clarifier have 15+ years of life, OPEX is the controlling number, and the receiving water is robust enough that the regulator is not pushing color or AOX limits, CAS with tertiary polishing still wins on 25-year NPV. The hybrid option — CAS followed by UF as a polishing/reuse step — gives most of the MBR effluent quality at lower membrane area and deserves a line in the alternatives evaluation.
Always run a 90–180 day on-site pilot with the actual mill wastewater before committing CAPEX. P&P effluent varies sharply by stock, furnish, and bleach sequence, and bench-scale or jar-test numbers are no substitute for the real stream.
Frequently Asked Questions
For a Fernandina Beach pulp & paper mill, is MBR or CAS the better 2026 default?
MBR is the 2026 default for any Fernandina Beach P&P mill that is land-constrained, targets in-plant water reuse, or discharges to a sensitive tidal water like Nassau Sound or the Atlantic Intracoastal. CAS with tertiary polishing still wins on 25-year NPV for high-flow mills with robust receiving waters and 15+ years of remaining life in the existing aeration basin and clarifier. The headline numbers: MBR delivers ~60% smaller footprint, sub-1 µm effluent, and ~0.4 MP/L microplastics versus ~1.0 MP/L for CAS, at the cost of higher energy (0.6–1.2 kWh/m³ vs 0.3–0.6) and membrane cleaning burden.
Can MBR alone hit color and AOX limits for a P&P mill?
No. The biological stage in either CAS or MBR delivers roughly 50–75% color removal; the remainder requires a tertiary step such as coagulation/DAF, ozone/UV advanced oxidation, or Fenton (Hermosilla et al. 2015, cited in Hubbe et al. 2016). For AOX, the bulk of the reduction happens upstream in the bleach sequence (elemental chlorine-free or totally chlorine-free substitution), not in the biological stage — though MBR's higher SRT does provide modestly better AOX reduction than short-SRT CAS.
What is the carbon-footprint difference between MBR and CAS for P&P wastewater?
The Mannina et al. (2020) plant-wide benchmark puts direct GHG at 0.85 kgCO₂eq/m³ for CAS and 0.91 kgCO₂eq/m³ for MBR — a difference inside the model uncertainty band and effectively a wash at the plant level. The real carbon story for an MBR retrofit is the indirect credits: in-plant reuse water displacement, avoided trucking of clarified sludge, and the lower microplastics loading on the receiving estuary.
What is the CAPEX scale for an MBR retrofit at a 5,000–20,000 m³/day P&P mill?
P&P MBR retrofits at this scale run materially higher in CAPEX than a like-for-like CAS upgrade, primarily because of the membrane cassettes, dedicated scour blowers, and CIP chemical systems. Karim & Mark (2017), cited in Mannina et al. (2020), found MBR becomes the most cost-effective option only beyond roughly a 67-year horizon, so on a 25-year NPV CAS still wins on pure cost. The right move is a mill-specific 90–180 day pilot to validate flux, cleaning frequency, and energy draw before any CAPEX commitment.
Can submerged MBR cassettes be dropped into an existing CAS aeration basin?
Often yes, with caveats. Submerged cassettes can frequently be installed in an existing aeration basin after the secondary clarifier is repurposed (as a sludge buffer, equalization basin, or removed entirely), but a hydraulic and blower audit is mandatory to confirm the existing aeration system can deliver the coarse-bubble scour demand and that the basin geometry supports the cassette layout. The biological acclimation to the higher SRT and MLSS also needs to be planned, and the sludge dewatering line should be reviewed — a HydropureWater plate and frame filter press handles waste activated sludge from either configuration.