
Why Footprint Decides the Technology Choice for Pharma Plants
For a 300 m³/day API plant in a Special Economic Zone, the question is not "MBR or CAS?" but "what fits in 180 m²?" Pharma manufacturing sites in SEZs and urban industrial parks typically cap ETP footprint at 150–400 m² for a 200–500 m³/day load, and that constraint is fixed long before the process engineer picks a technology. Land cost in 2026 industrial parks benchmarks USD 800–2,000 per m², so every m² reclaimed pays back the MBR CAPEX premium in 3–5 years. API plants face a COD load 5–10× higher than municipal sewage, which forces larger aeration tanks in CAS; when the plot is already carved up, larger is not an option. An integrated MBR system that occupies roughly 60% of the plot of a CAS train is the realistic answer for brownfield pharma sites, as confirmed by HydropureWater's verified product catalog (S6). The technology decision is a land-economics decision first, and a process decision second.
How Conventional Activated Sludge Treats Pharma Effluent
CAS consists of a defined train: equalisation, primary clarifier, aeration tank, secondary clarifier, and disinfection. The aeration tank runs at an MLSS of 2,000–4,000 mg/L, which is the upper limit at which the secondary clarifier can still settle the mixed liquor reliably. When antibiotic or solvent toxicity exceeds ~30 mg/L in the mixed liquor, floc-forming bacteria lose viability and the clarifier carries solids over. The secondary clarifier alone consumes 25–35% of total ETP footprint for a 300 m³/day plant, which is why a footprint-constrained API site quickly runs out of room. CAS effluent typically sits at 80–150 mg/L COD and 15–30 mg/L TSS; this is not reuse-grade and requires a tertiary polishing step (often a lamella clarifier followed by sand/carbon filtration or RO) before it can be sent to cooling-tower makeup. CAS is well understood and inexpensive, but it is space-hungry and brittle under pharma toxicity swings, as documented in the IJEST pharmaceutical treatment bibliography (S4).
How MBR Treats API and Formulation Wastewater Differently
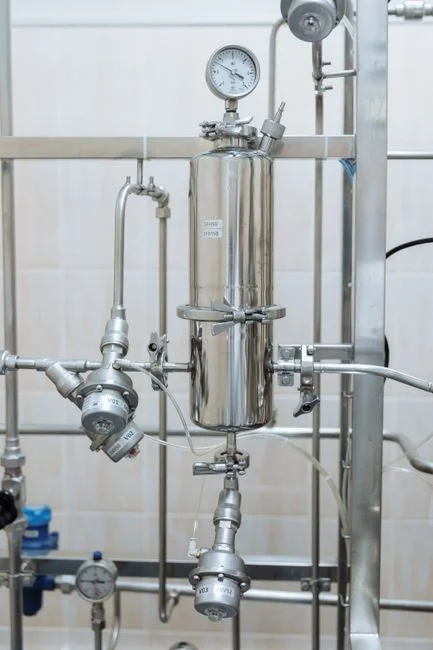
An MBR replaces the secondary clarifier with submerged 0.1 μm PVDF ultrafiltration membranes, performing solids separation by physical filtration rather than gravity settling. Per the Montpellier thesis on MBR activated-sludge viability (S3), a membrane cut-off in the 0.04–0.2 μm range retains bacteria and most viruses, so the effluent leaving the tank is largely disinfected. Because the membrane does the separation, MLSS can run at 8,000–12,000 mg/L — roughly 3× the CAS ceiling — which shrinks the aeration tank volume by 40–50% at the same F:M ratio. HydropureWater's DF series flat sheet membrane module integrates an aeration box beneath each cassette, so the same blower that supplies oxygen to the biomass also drives continuous air scour across the membrane surface, suppressing fouling without a separate cleaning cycle. MBR effluent typically tests at COD ≤50 mg/L, TSS ≤5 mg/L, and turbidity <1 NTU, which is directly reusable for cooling-tower makeup or as RO feed — a How MBR Effluent Quality Works: Engineering Specs, Removal Rates & Real-World Performance Data brief walks through the removal numbers in more depth. MBR trades a clarifier for a membrane, unlocking the footprint and reuse combination CAS cannot match.
MBR vs CAS for Pharma: Parameter Comparison
The table below summarizes the decision variables an EPC needs to price before procurement. Indices are normalized to CAS = 1.0 so the same format works for a 100 m³/day formulation line or a 500 m³/day API plant.
| Parameter | CAS | MBR |
|---|---|---|
| Footprint (m² per m³/day) | 0.8–1.2 | 0.3–0.5 |
| MLSS tolerance (mg/L) | 2,000–4,000 | 8,000–12,000 |
| Effluent COD (mg/L) | 80–150 | ≤50 |
| Effluent TSS (mg/L) | 15–30 | ≤5 |
| Effluent turbidity (NTU) | 5–15 | <1 |
| CAPEX index | 1.0 (baseline) | 1.2–1.4 |
| OPEX drivers | Aeration + sludge handling | Aeration + membrane maintenance + periodic CIP |
| Hydraulic tolerance to COD swing | Low (clarifier washout risk) | High (membrane buffers peaks) |
| Reuse readiness | Requires tertiary polishing | Direct to cooling-tower / RO feed |
For a 300 m³/day API plant, the footprint delta alone is roughly 180–270 m² reclaimed, which at USD 1,200/m² industrial-park land cost is USD 216,000–324,000 of CAPEX-equivalent value realized on day one. The 2026 ROI breakdown for a comparable capacity is laid out in the MBR Wastewater Treatment System in Ireland: 2026 Engineering Guide with Costs, Compliance & ROI Data brief, which applies the same 10-year lifecycle framing.
Pharma-Specific Stressors That Push Plants Toward MBR
Generic municipal comparisons understate how hard pharma wastewater hits a CAS train. Antibiotic residues from beta-lactam, macrolide, and sulphonamide production suppress the floc-forming bacteria that CAS relies on for settling, and the IJEST pharmaceutical treatment bibliography (S4) documents this as a recurring failure mode. Solvent carryover from formulation lines — typically methanol, acetone, or DMSO at hundreds of mg/L — causes deflocculation in the clarifier and triggers sludge washout events that take days to recover from. Salinity spikes from API synthesis washwater (NaCl at 5–15 g/L) disrupt CAS nitrification, while MBR's higher MLSS and complete solids retention stabilize the microbial community because slow-growing nitrifiers are no longer washed out with the effluent. Variable batch production drives COD swings from 1,500 to 8,000 mg/L between campaigns, and the membrane in an MBR hydraulically decouples the biology from the effluent quality, so a 5× COD spike does not produce a 5× effluent excursion as it does in a clarifier-based train. These stressors are the daily operating reality at most mid-to-large API/formulation sites.
The Honest Trade-offs: MBR CAPEX Premium and Fouling Risk
MBR requires a higher initial investment than CAS. CAPEX runs 20–40% above CAS because membrane modules, scour blowers, and CIP skids are added to the bill of materials, and that delta is the first objection every procurement manager raises. Fouling is manageable: flat-sheet designs with continuous air scour (such as the DF series flat sheet membrane module) consume 10–20× less energy than cross-flow hollow-fibre systems, and routine CIP every 6–12 months with dilute NaOCl or citric acid restores permeability. The CAPEX premium is recovered in 3–5 years on footprint-constrained sites through three channels: reclaimed plot value (USD 800–2,000 per m²), eliminated tertiary polishing, and avoided sludge-hauling costs from operating at 3× the MLSS. For a site where land is the binding constraint, the question is whether the plant can afford to continue paying for land it does not have.
Decision Framework: When MBR Wins, When CAS Still Makes Sense
Use this rule set in your next project meeting:
- Choose MBR when the available plot is under 500 m² for a 100+ m³/day load, effluent reuse is required, COD variability is high (>3× swings batch-to-batch), or antibiotic/solvent toxicity is documented.
- Choose CAS when land is cheap (
- Hybrid CAS+MBR retrofit: keep the existing aeration tank and replace the secondary clarifier with a membrane cassette. A typical retrofit cuts footprint by 35% at roughly 50% of full MBR CAPEX, and is often the only viable path on a brownfield site where the existing civil works cannot be demolished.
- Threshold rule: at land cost above USD 800/m², MBR wins on 10-year lifecycle cost for any flow above 100 m³/day, once tertiary polishing and sludge disposal are priced in.
The hybrid path is the realistic answer for many brownfield pharma sites, and an EPC who presents this option during a board meeting often earns credibility quickly.
Frequently Asked Questions
How much smaller is an MBR footprint than CAS for pharma wastewater?
MBR delivers a 50–60% footprint reduction versus CAS at the same flow. The mechanism is twofold: the secondary clarifier is replaced by a submerged membrane cassette occupying roughly 10% of the clarifier footprint, and the aeration tank volume shrinks by 40–50% because MLSS can run at 8,000–12,000 mg/L instead of 2,000–4,000 mg/L. For a 300 m³/day API plant, that translates to roughly 180–270 m² reclaimed.
Why does pharma wastewater favour MBR over CAS?
Pharma influent carries antibiotic residues (beta-lactams, macrolides, sulphonamides), solvent carryover from formulation lines, and salinity spikes of 5–15 g/L NaCl from API synthesis washwater. These stressors suppress CAS floc-forming bacteria, cause deflocculation in secondary clarifiers, and disrupt nitrification. MBR's higher MLSS and complete solids retention stabilize the microbial community, and the membrane buffers COD swings of 1,500–8,000 mg/L without effluent excursions.
What is the CAPEX premium for MBR versus CAS, and what is the payback?
MBR CAPEX runs 20–40% above CAS due to membrane modules, scour blowers, and CIP skids. On a footprint-constrained site where reclaimed plot value is priced at USD 800–2,000 per m², the premium is recovered in 3–5 years, with additional savings from eliminated tertiary polishing and lower sludge-hauling volumes.
How is membrane fouling controlled in an MBR treating pharma wastewater?
Flat-sheet modules with integrated aeration boxes (such as the DF series) use continuous air scour across the membrane surface, which suppresses fouling without separate cleaning cycles and consumes 10–20× less energy than cross-flow designs. Routine clean-in-place every 6–12 months with dilute NaOCl or citric acid restores permeability to near-original levels.
Is a hybrid CAS+MBR retrofit a viable option for an existing pharma ETP?
Yes. Replacing the secondary clarifier with a membrane cassette while keeping the existing aeration tank typically cuts footprint by 35% at roughly 50% of full MBR CAPEX. It is often the only realistic path on a brownfield site where the existing civil works cannot be demolished, and it delivers most of the reuse-grade effluent benefit of a full MBR conversion.