Why Willow Island Chemical and Pharma Plants Are Re-Evaluating CAS in 2026
Willow Island, Pleasants County, sits on the Ohio River and anchors a chemical manufacturing corridor of legacy organic chemicals (NAICS 325199), custom chemical preparations (NAICS 325193), and adjacent pharmaceutical manufacturing (NAICS 325411) — the kind of plant mix that drives 40 CFR 414 organic chemicals effluent limits and 40 CFR 439 pharmaceutical manufacturing limits simultaneously. The Ohio River downstream of Willow Island is also a West Virginia surface-water discharge corridor, so NPDES permits issued by WVDEP routinely incorporate whole effluent toxicity (WET) testing alongside the federal categorical baselines. Many of the activated sludge trains still running here were designed in the 1990s and 2000s, sized for BOD/COD removal, and never anticipated trace API residues, lower surface-water discharge limits, or the tighter WET pass/fail variability that modern permits enforce. The practical problem the engineer is staring at is not "BOD removal failed" — it is "my clarifier weirs are throwing biomass during a Tuesday solvent batch, my monthly WET is borderline, and corporate wants an upgrade memo by Friday." The nearby-Ohio-Valley compliance guide lays out the regulatory framing, and the EPA's Membrane Bioreactors fact sheet is unambiguous: MBR has moved from small-flow niche to full-scale industrial use as membrane costs fell and footprints shrank. For Willow Island's chemical corridor, that timing is what makes 2026 the year the CAS retrofit question gets a real answer.
MBR vs CAS at a Glance: Side-by-Side Parameters
An integrated MBR system runs at 8,000–12,000 mg/L MLSS and SRT of 20–60 days; CAS runs at 1,500–4,000 mg/L and 5–15 days SRT (per EPA MBR fact sheet). The table below is the working comparison a process engineer can paste into a memo; the prose that follows translates each row into something you can see on the floor.
| Parameter | CAS (conventional activated sludge) | MBR (submerged membrane bioreactor) |
|---|---|---|
| MLSS (mg/L) | 1,500–4,000 | 8,000–12,000 |
| SRT (days) | 5–15 | 20–60 |
| HRT (hours) | 6–12 | 2–6 |
| Membrane pore size | none (settling-based) | ~0.1 µm flat-sheet PVDF or ~0.04 µm hollow-fiber UF (EPA fact sheet; HydropureWater DF series) |
| Footprint multiplier (same flow) | 1.0× (baseline) | ~0.4× — roughly 60% smaller (HydropureWater DF-series spec) |
| Effluent TSS | 10–30 mg/L | <5 mg/L, typically <1 mg/L (EPA Calls Creek data, 2005) |
| Effluent BOD | 15–30 mg/L | <5 mg/L, often below detection (EPA fact sheet) |
| Effluent turbidity | 5–15 NTU | <1 NTU (EPA Calls Creek, 0.3 NTU average) |
| Effluent NH3-N | 1–5 mg/L (nitrification limited at low SRT) | <1 mg/L stable (EPA Cauley Creek data) |
| Sludge yield (Yobs) | 0.3–0.5 kg TSS/kg COD | 0.15–0.30 kg TSS/kg COD at long SRT |
| CAPEX index (same flow) | 1.0× (baseline civil + tankage) | 1.3–1.8× — savings on clarifiers/sand filters offset by membranes and cassettes (EPA fact sheet; engineering judgement) |
| OPEX driver | Aeration blower kWh, sludge haul | Membrane cleaning chemicals (NaOCl + citric acid), air-scour blower kWh, periodic membrane replacement |
On the floor, the table reads as follows: the MBR aeration basin shrinks to roughly 40% of the CAS volume because MLSS quadruples; the secondary clarifier and the sand filter disappear and are replaced by membrane cassettes in a tank; aeration blower kWh per kg BOD rises because of higher mixed-liquour viscosity and the dedicated membrane air-scour, but the clarifier return-activated-sludge pumping loop is gone. Functionally, CAS and MBR are equivalent on gross BOD for a readily biodegradable chemical waste — there is no premium in chasing BOD if that is the only permit metric. The premium starts where TSS, turbidity, nitrification stability, and the next upgrade to reuse or RO are the binding constraints.
How the Two Systems Treat Pharmaceutical and Organic Chemical Waste
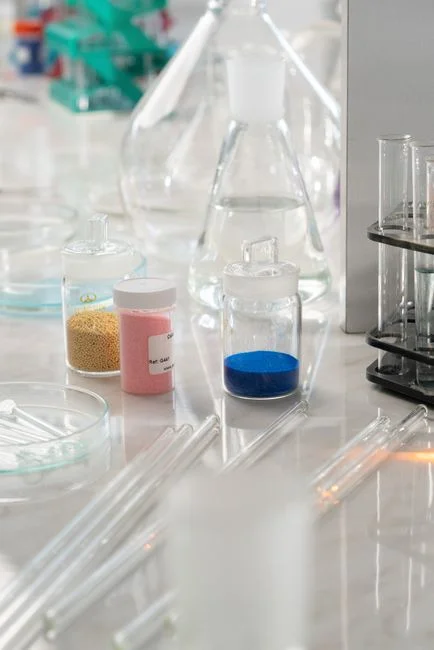
A conventional CAS train in this corridor typically runs: equalization basin → bar screen → primary clarifier (often a DAF for chemical feeds) → aeration basin → secondary clarifier → chlorine or UV disinfection, with return/waste activated sludge and a digester or filter press on the side. The unit operation that fails first is almost always the secondary clarifier — when a batch hits the basin with solvent or low-pH slug, biomass loses floc structure, the sludge blanket pinches over the weir, and TSS spikes. A submerged MBR replaces the secondary clarifier and the sand filter with a membrane cassette, so the failure mode is no longer "did the sludge settle" but "did the membrane foul." For Willow Island, the DF series flat-sheet MBR cassette configuration is the natural fit for organic chemical feeds because flat-plate membranes tolerate 2–3 mm screening rather than the 1–2 mm required by hollow-fiber (per EPA fact sheet), and that smaller screening differential translates into fewer screen-cleaning interventions on a chemical site with batch swings.
For the process flow, MBR trains run: coarse screening → equalization → fine screening (1–3 mm) → biological reactor (often anoxic + aerobic) → submerged membrane tank → permeate → UV or ClO2 → optional advanced oxidation for APIs. The membrane step is what unlocks the higher MLSS, but it is also where fouling control lives — air scour below the cassettes, periodic back-pulse or relaxation, and clean-in-place with sodium hypochlorite and citric acid on a defined maintenance interval. Where MBR shows its real value for Willow Island's pharma-adjacent waste is when a polishing step is bolted on: per the Molecules 2025 photocatalysis study, a g-C3N4/rGO nanocomposite under UV achieved complete removal of diclofenac and sulfamethoxazole in 30 minutes from MBR-treated wastewater, and boosted ibuprofen and carbamazepine degradation by approximately 19% and 13% respectively versus UV alone (Molecules, 2025). That result frames the section that follows: MBR is a more complete platform than CAS for trace APIs, but on its own it is not the finish line for the recalcitrant few.
Pharmaceutical and Trace-API Removal: Where MBR Pulls Ahead
CAS struggles with persistent APIs for three reasons that all point back to short SRT and a settling-based separation. SRT of 5–15 days is shorter than the doubling time of many specialist degraders, so they wash out. The clarifier offers no physical barrier to soluble, low-molecular-weight APIs, so whatever the biomass cannot mineralize passes through. And under a toxic slug, the biomass that does degrade APIs is exactly the biomass that gets lost over the weir. MBR addresses the first two: SRT of 20–60 days enriches slow-growing nitrifiers and specialist heterotrophs, and the 0.1 µm flat-sheet membrane retains both biomass and high-molecular-weight dissolved matter. The combined effect is meaningfully higher removal of bulk APIs and bulk BOD, but the data is honest about the limit: MBR alone does not fully remove carbamazepine, diclofenac, and similar recalcitrant molecules to the levels expected under proposed EPA effluent guidelines and EU watch-list thresholds for surface-water discharge on the Ohio River. The table below maps the practical behavior the engineer should plan for, not laboratory maximum removals.
| Target compound | CAS typical removal | MBR typical removal | MBR + photocatalytic/AOP post-treatment |
|---|---|---|---|
| Ibuprofen (bulk API) | 60–90% | 80–95% | ~99% (≈19% boost over UV alone, Molecules 2025) |
| Carbamazepine (recalcitrant) | 0–30% | 10–50% | Substantial gain (~13% boost over UV alone, Molecules 2025) |
| Diclofenac (recalcitrant) | 0–40% | 20–60% | Complete removal in 30 min (Molecules 2025) |
| Sulfamethoxazole (variable) | 30–70% | 50–80% | Complete removal in 30 min (Molecules 2025) |
The operational translation is straightforward: build the MBR to handle bulk API, BOD, and TSS, and budget for a polishing step — photocatalysis under UV, ozone, or AOP — to take the recalcitrant four down to discharge or reuse limits. A chlorine dioxide polishing step is the practical finishing position for many chemical plants because it does not introduce bromate formation the way ozone can on a high-bromide Ohio River feed.
Footprint, Permitting, and the Willow Island Site Reality
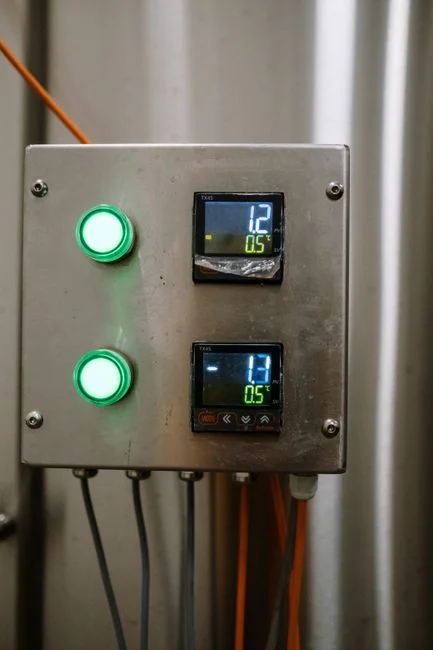
Footprint is often the binding constraint for a 1990s-vintage chemical plant that has since been boxed in by tank farms, rail, and a leased lay-down yard. The HydropureWater DF-series MBR spec delivers roughly 60% smaller footprint than CAS for the same flow, in a 10–2,000 m³/day capacity range that covers both small specialty chemical operations and mid-size API facilities. The EPA fact sheet adds a critical flow-engineering point that the engineer should hold onto: peak design flow should be no more than 1.5–2× the average design flow without equalization, because membrane throughput is set by physical permeability. Both CAS and MBR need flow equalization for batch chemical operations, so the equalization basin stays in the design either way.
On the permit side, replacing a secondary clarifier and adding a membrane train at a Willow Island facility typically triggers a minor modification under 40 CFR 122.63, not a full new permit — but the WVDEP reviewer will still want updated mixing-zone data and a current WET result, and if the upgrade changes the hydraulic profile the engineer should expect at least one round of pilot data. Flat-sheet MBRs also have a quieter air-scour profile than external cross-flow tubular systems — on the order of 10–20× lower air-scour energy, per the HydropureWater DF series spec — which matters on a site with limited blower capacity or a tight noise boundary. For feeds with high FOG or solvent load, a DAF pretreatment ahead of the MBR is the standard configuration; it cuts the FOG load that drives the worst fouling events.
CAPEX, OPEX, and 20-Year Life-Cycle View
The EPA MBR fact sheet is direct: MBR historically carries higher equipment and membrane cost than CAS for equal throughput, and the primary O&M cost drivers are membrane cleaning chemicals, air-scour blower energy, and eventual membrane replacement. The reasonable CAPEX framing for a Willow Island chemical plant is that the MBR package lands at 1.3–1.8× the civil-plus-tankage cost of a like-for-like CAS, with savings on the secondary clarifier, sand filters, and some yard piping. On the OPEX side, the membrane replacement cadence is the single biggest lever — Zenon's municipal guarantee is 10 years; other manufacturers and most industrial-feed guarantees land at 3–5 years (EPA fact sheet). Use that range as the planning assumption, not the optimistic case. MBR's longer SRT and lower observed yield (Yobs 0.15–0.30 vs CAS 0.3–0.5 kg TSS/kg COD) reduce waste-activated-sludge volume, which is meaningful on a chemical site where sludge is hauled as hazardous waste. The table below is the 20-year LCCA template the engineer can populate with site-specific numbers rather than a fabricated total.
| 20-year LCCA line item | CAS (baseline assumptions) | MBR (DF series assumptions) |
|---|---|---|
| Membrane/cassette replacement count | 0 | 2–4 (3–10 yr cadence; EPA fact sheet, Zenon 10-yr guarantee) |
| Cleaning chemicals (NaOCl + citric acid) | 0 | Annual, ~2–4% of membrane CAPEX (engineering judgement) |
| Blower energy (aeration + air scour) | 1.0× (baseline kWh/yr) | 1.1–1.4× including dedicated membrane air-scour |
| Waste activated sludge volume | 1.0× (baseline) | 0.5–0.7× of CAS at long SRT |
| Operator hours | 1.0× (baseline) | ~1.2× during commissioning, then ~0.9× steady-state |
A plate-and-frame filter press downstream is unchanged across either configuration; that equipment is sludge-handling, not biological. The honest framing for management is that MBR is the higher-CAPEX, lower-footprint, lower-sludge, more-operator-training option, and the trade-off closes in MBR's favor when the avoided clarifier/sand-filter CAPEX, the sludge-haul savings, and the tightened effluent quality stack up against membrane replacement over 20 years.
Decision Framework: When CAS Still Wins, When MBR Does
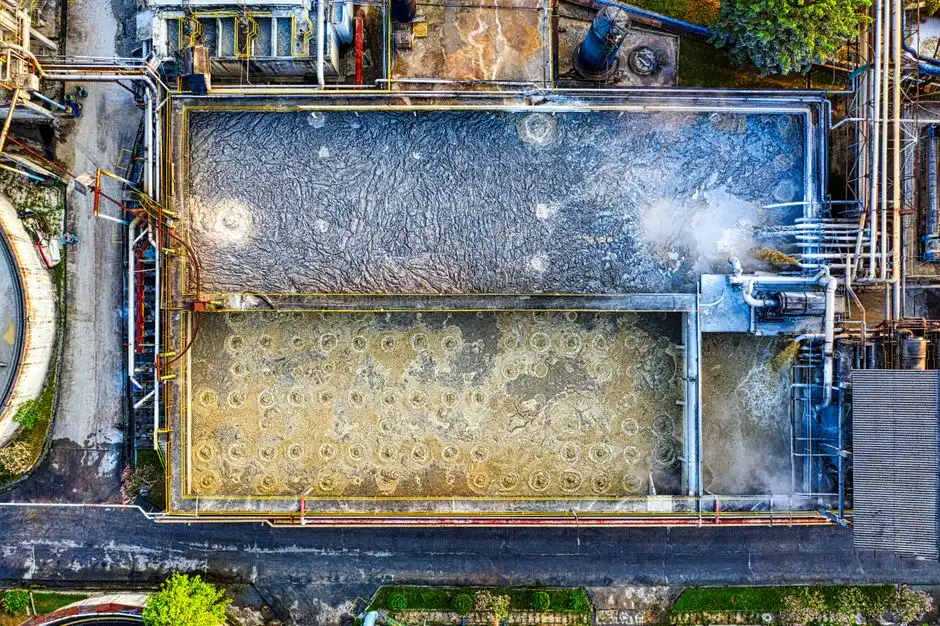
CAS still wins the head-to-head when the flow is steady, the BOD is readily biodegradable, there are no API residues, footprint is unconstrained, and CAPEX is the binding constraint. That profile describes some specialty chemical operations on the Willow Island corridor but fewer of them every year as WET variability and surface-water-quality expectations tighten. MBR wins when effluent must meet low TSS and low turbidity for reuse, footprint is tight, batch toxicity events cause clarifier failure, trace APIs or solvents are present, or a future upgrade to RO reuse is on the planning horizon. The third path worth taking seriously is hybrid: keep the existing aeration basin, drop the secondary clarifier out of service, and install submerged flat-sheet membrane cassettes in the vacated clarifier volume. That retrofit shape is the lowest-disruption way to capture most of MBR's TSS/turbidity/API benefits without touching the upstream biology, and the MBR footprint reference case is the closest analog for how the layout closes on a constrained industrial site. The defensible recommendation for a Willow Island chemical preparations or pharmaceutical plant in 2026 is: pilot MBR on the worst batch stream for 60–90 days, generate the WET and trace-API data the WVDEP reviewer will ask for, and use the LCCA template in this guide to defend the upgrade at the next management review.
Frequently Asked Questions
Is MBR always better than CAS for pharmaceutical wastewater?
No. MBR improves removal of bulk APIs and stabilizes effluent quality under batch toxicity, but persistent molecules like carbamazepine and diclofenac still need an advanced oxidation polishing step. The 2025 Molecules photocatalysis study showed g-C3N4/rGO + UV after MBR removed diclofenac and sulfamethoxazole completely in 30 minutes, and improved ibuprofen and carbamazepine degradation by ~19% and ~13% respectively over UV alone — strong evidence that MBR is the right biological front end, but not the finish line.
What pore size of MBR membrane is used for chemical preparations wastewater?
Typical industrial MBR membranes are 0.1 µm flat-sheet PVDF or ~0.04 µm hollow-fiber UF (per the EPA MBR fact sheet and the HydropureWater DF series spec). Flat-sheet tolerates 2–3 mm screening; hollow-fiber requires 1–2 mm, which means more frequent screen cleaning on a chemical feed with debris.
How much smaller is the MBR footprint versus CAS?
About 60% smaller for the same flow in the HydropureWater DF series spec, with a 10–2,000 m³/day capacity range that fits both small specialty chemical plants and mid-size API facilities. The shrinkage comes from running 8,000–12,000 mg/L MLSS instead of 1,500–4,000 mg/L.
What is the biggest OPEX risk for MBR retrofits in Willow Island?
Membrane fouling from FOG and solvent batches. Mitigate with DAF pretreatment and 1–3 mm fine screens ahead of the cassettes, and budget for clean-in-place with sodium hypochlorite and citric acid on a defined maintenance interval. For UV disinfection polishing, a UV transmittance sensor closed-loop trim prevents under- or over-dosing as the MBR effluent quality varies.
Does MBR help with NPDES whole-effluent toxicity (WET) testing?
Yes. Higher and more stable MLSS plus a physical membrane barrier reduces the effluent variability that drives WET failures, especially under batch toxicity events that would otherwise push biomass over the clarifier weir. Stable MLSS, stable nitrification, and low TSS are the three WET-pass enablers MBR brings relative to CAS.