
Why Food and Beverage Wastewater in Green Forest Forces the MBR vs CAS Question
For Green Forest, Arkansas food and beverage plants, MBR outperforms conventional activated sludge (CAS) on effluent quality, footprint (roughly 60% smaller) and reuse-readiness, but costs more to operate and only becomes the cheaper lifecycle option after about 67 years per Karim and Mark (2017). The right choice depends on influent strength — F&B wastewater runs 3.9–10.7x higher than municipal on BOD, COD, TN and TSS — and on whether the plant targets ADEE discharge compliance alone or on-site water reuse.
The comparison is not academic for operators in Carroll County. Food and beverage (F&B) streams are punishing because their organic load is several multiples of medium-strength municipal sewage, and that load swings hourly with clean-in-place (CIP) cycles, seasonal throughput, and batch product changeovers. Using the MDPI Processes slaughterhouse review as a representative F&B benchmark (2022-06), average slaughterhouse wastewater runs 3.9x higher for TOC, 6.3x for BOD₅, 9.8x for COD, 10.7x for TN, 5.5x for TSS, and 7.1x for TP than medium-strength municipal sewage. Meat processing alone consumes roughly 24% of total F&B industry freshwater use (Bustillo-Lecompte and Mehrvar, 2015), so any Green Forest-area capital story around water stewardship starts with a serious wastewater problem.
High-strength, variable streams punish gravity clarifiers in three concrete ways: fats, oil and grease (FOG) coat floc and cause bulking sludge that escapes over the clarifier weir; CIP peaks double or triple hydraulic loading in minutes, washing biomass out of the secondary settler; and antimicrobial residues disrupt nitrification. The Arkansas Department of Energy & Environment, Division of Environmental Quality (ADEQ) administers NPDES permits under Regulation 2 and applies nutrient criteria under Regulation 38, so tightening effluent targets (BOD, TSS, ammonia, and in some reaches phosphorus) push operators toward either MBR or a CAS-plus-tertiary upgrade. The two competing paths this article will compare are: (a) upgrade the existing CAS train with better clarification, equalization and possible DAF pretreatment, or (b) replace the clarifier with a membrane stage and run the bioreactor at higher MLSS.
How Conventional Activated Sludge and MBR Actually Treat F&B Streams Differently
The two technologies share a front end: an aeration basin where heterotrophic bacteria oxidize organics and nitrifiers convert ammonia to nitrate. What separates them is the solid/liquid separation step, and that single difference cascades into every operating parameter an engineer cares about.
In CAS, mixed liquor flows from the aeration basin to a circular or rectangular clarifier. Biomass settles by gravity; clarified water overflows the weir. The clarifier is the weak link. FOG reduces floc density, and at high hydraulic loading the blanket rises and biomass escapes — a phenomenon operators see as rising sludge on the effluent launder. F&B plants running CAS learn to live with periodic TSS excursions during CIP peaks.
In an MBR, the same biological step runs, but the clarifier is replaced by a submerged membrane module. Pore sizes in commercial MBR systems sit at <1 μm (typical PVDF flat sheet) or 0.04–0.2 μm in the academic literature (theses.fr 2012MON20265), which retains biomass, virtually all bacteria, and a large fraction of viruses. Mannina et al. summarize the four MBR advantages, citing Ma et al. (2018): higher SRT enables degradation of recalcitrant compounds; lower observed cell yield produces less waste sludge; the physical barrier delivers very high effluent quality; and the absence of a clarifier cuts footprint dramatically. The two MBR disadvantages from the same source are membrane fouling (which raises transmembrane pressure and reduces flux) and the energy for fouling control — chemical cleanings, relax cycles, and continuous membrane-scouring aeration, which is the single largest energy sink in an MBR plant (Judd, 2016; Xiao et al., 2019).
Because the membrane retains all biomass, MBR plants can run the aeration tank at 8–12 g/L MLSS versus 2–4 g/L in a typical CAS clarifier-limited system. The biomass stays in the reactor instead of over the weir, so the basin shrinks. This is the source of the ~60% smaller footprint figure quoted for the HydropureWater MBR system, and it is what makes MBR the default answer on space-constrained F&B sites.
MBR vs CAS Side-by-Side: The Numbers That Matter for a Green Forest Plant
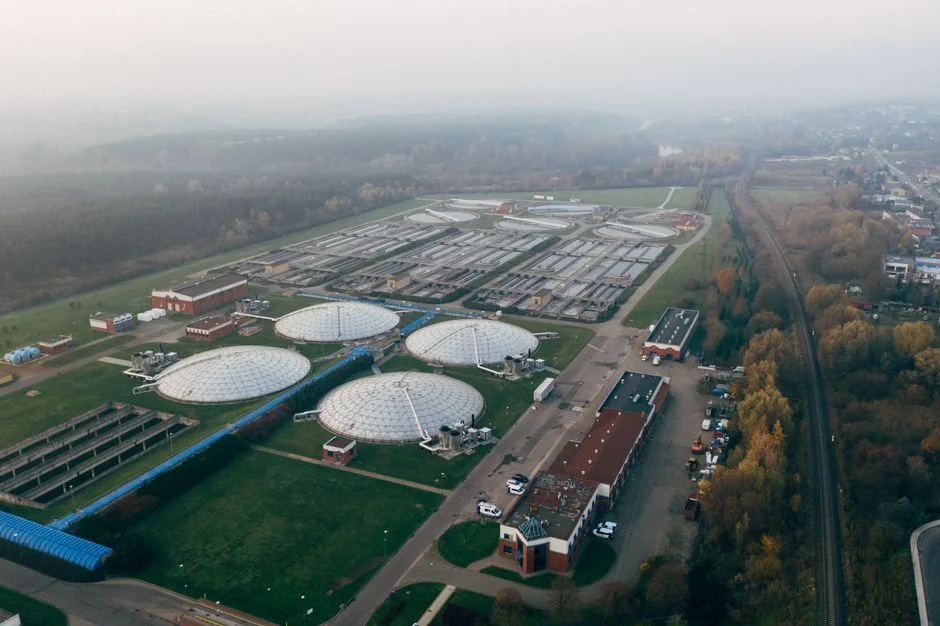
Below is the parameter table an engineer in north-central Arkansas can copy into a project memo. MBR and CAS baseline values are drawn from Mannina et al. (Bioresource Technology 2020) and the IWS process explainer; F&B-specific framing follows the MDPI Processes review.
| Parameter | Conventional Activated Sludge (CAS) | Membrane Bioreactor (MBR) | What it means for a Green Forest F&B plant |
|---|---|---|---|
| MLSS in aeration tank | 2–4 g/L (clarifier-limited) | 8–12 g/L (membrane retains biomass) | Smaller aeration basin; better shock-load resilience |
| Sludge Retention Time (SRT) | 5–15 days typical | 20–60+ days | MBR degrades recalcitrant compounds and antimicrobial residues |
| Effluent TSS | 10–30 mg/L (with good settling) | <1–5 mg/L | MBR effluent is often reuse-ready without tertiary filtration |
| Effluent BOD₅ | 10–30 mg/L | <5 mg/L | Easily meets ADEQ Regulation 2 BOD limits |
| Effluent COD | 50–120 mg/L | <30 mg/L | Tighter margin against Regulation 38 nutrient-driven oxygen demand |
| Microplastic capture (Lares et al., 2018) | 1.0 MP/L in effluent | 0.4 MP/L in effluent | MBR preferred for sensitive receiving waters in Arkansas |
| Direct GHG emissions (Mannina et al.) | 0.85 kgCO₂eq/m³ | 0.91 kgCO₂eq/m³ | MBR is not automatically greener on carbon; the case flips when reuse displaces freshwater intake |
| Footprint | Reference baseline | ~60% smaller (per HydropureWater MBR system field data) | Critical on tight Green Forest industrial lots |
| Energy demand | ~0.3–0.5 kWh/m³ (aeration only) | ~0.6–1.0 kWh/m³ (membrane scouring dominates) | MBR carries a real OPEX penalty on the power bill |
| Sludge yield | Reference | ~20–30% lower observed yield (Ma et al., 2018) | Lower biosolids hauling cost — a real line item in rural Arkansas |
| CAPEX intensity | Lower initial | ~20–40% higher (Karim and Mark, 2017) | CAS train is cheaper to build |
| OPEX profile | Energy + sludge hauling | Energy for scouring + membrane replacement on a regular schedule (IWS) + chemical CIP | MBR's higher OPEX offsets the CAPEX gap only over very long horizons |
| Lifecycle crossover (Karim and Mark, 2017) | Wins in <67 years | Only beats CAS on total operating cost beyond ~67 years | Most plants will not hold the same train for 67 years; reuse savings can shorten the crossover |
| Reuse-readiness | Needs tertiary filtration + disinfection | Often reuse-ready as-is for CIP, boiler feed, irrigation | Drives the MBR case when water reuse is the goal |
The honest read of these numbers: MBR wins decisively on effluent quality, footprint, and reuse-readiness, but loses on energy intensity and CAPEX. For an established Green Forest-area food plant, the cost question is not "which is cheaper" but "which combination of CAPEX phasing, reuse credit, and biosolids savings closes the gap on a realistic 15–25 year horizon." A DF series flat sheet membrane module retrofitted into an existing aeration tank is the most common way to bridge that gap without writing a full CAPEX check on day one.
Matching the Technology to the F&B Sub-Segment in Green Forest
Generic MBR-vs-CAS verdicts fail F&B operators because the right answer depends on the sub-segment. The MDPI loading data, the Mannina performance data, and the IWS process notes all converge differently depending on whether a plant is processing poultry, dairy, beverage, or fruit and vegetable streams.
| F&B Sub-Segment | Loading Profile | Recommended Path | Rationale |
|---|---|---|---|
| Poultry / red meat | Very high BOD/COD/FOG; antimicrobial residues; 24% of F&B freshwater use (Bustillo-Lecompte and Mehrvar, 2015) | DAF pre-stage + MBR preferred; CAS+DAF if reuse is not a goal | DAF removes FOG before it fouls membranes or bulks CAS sludge; MBR handles residue-laden, high-strength stream |
| Dairy | High fat and protein load; significant cleaning chemistry; variable temperature | MBR preferred when space or reuse is a driver; CAS viable with generous equalization | MBR's physical barrier protects downstream disinfection; CAS struggles with recovery after thermal/load shocks |
| Beverage / brewery | Lower BOD/COD but extreme flow variability from campaign-driven CIP peaks | CAS with generous equalization if reuse is not a target; MBR if reuse is a target | Equalization solves the CAS problem; MBR's resilience to peak loads and tighter effluent are the differentiators |
| Fruit and vegetable | Seasonal operation; high TSS and sugar load; long idle periods | Both work; MBR preferred when building space has alternative use | MBR's smaller footprint suits seasonal plants that want to repurpose building space during shutdowns |
For the poultry and red meat segment that anchors the Green Forest area, a DAF system in front of either CAS or MBR is no longer optional — FOG loads at 7.1x municipal TP and FOG excursions will shut down a clarifier and foul a membrane without pretreatment. DAF also reduces the membrane scouring energy penalty in MBR service, which is the single largest OPEX line in the MBR column above.
When to Stay with CAS, When to Switch to MBR, and When to Retrofit a Hybrid
The decision framework below is the one to put in front of a CFO and a state regulator, not a vendor.
Stay with CAS (or CAS + DAF + better clarifier) when the existing basin has 20+ years of structural life, the discharge permit is conventional BOD/TSS with no nutrient or reuse target, and the receiving stream is not on the state's list of nutrient-impaired waters. CAS plus a properly sized DAF and a modern plate-pack clarifier can hit 30/30 BOD/TSS reliably on F&B streams if the upstream equalization is generous.
Switch to MBR when (a) the site is space-constrained and a new clarifier will not fit, (b) the plant has an active or planned on-site reuse goal — CIP rinse, boiler feed, cooling tower make-up, or landscape irrigation — that the current CAS effluent cannot meet without a tertiary filtration stage, or (c) the receiving water or reuse spec demands near-reuse-quality effluent, including low microplastic counts and meaningful pathogen reduction (Lares et al., 2018).
Retrofit a hybrid when the operator wants to phase CAPEX. Keep the existing aeration tank and blowers, drop a membrane cassette into a new concrete or packaged membrane tank downstream, and run the system at 8–12 g/L MLSS. This is the most common path for established Green Forest-area food plants, and it preserves 60–70% of the existing civil work. One non-obvious trade-off: MBR's lower observed sludge yield (Ma et al., 2018) reduces biosolids hauling costs in rural Arkansas, where transport to landfill or land-application sites is a real recurring line item — a savings CAS-only retrofits cannot match.
Frequently Asked Questions
Is MBR cheaper than CAS over the life of a food and beverage plant?
Not on a typical 15–25 year horizon. Karim and Mark (2017) found that MBR only becomes the lower total operating cost option after about 67 years of operation, because the higher CAPEX and OPEX (membrane scouring energy, chemical cleanings, periodic membrane replacement) take that long to recover through effluent quality gains alone. On-site water reuse credit shortens the crossover significantly.
How much smaller is an MBR footprint than a CAS plant treating the same F&B load?
Approximately 60% smaller for an equivalent design load, per HydropureWater MBR system field data. The reduction comes from running the aeration basin at 8–12 g/L MLSS instead of 2–4 g/L, which is possible because the membrane retains all biomass and eliminates the clarifier footprint.
Is MBR greener than CAS on greenhouse gas emissions?
No, not by itself. Mannina et al. measured 0.91 kgCO₂eq/m³ for MBR versus 0.85 kgCO₂eq/m³ for CAS. The carbon case for MBR only flips positive when the higher-quality effluent enables reuse that displaces freshwater intake, or when the lower sludge yield reduces biosolids transport emissions.
What F&B wastewater loading should a Green Forest plant design for?
Using the MDPI Processes slaughterhouse review as a representative F&B benchmark, expect roughly 3.9x higher TOC, 6.3x BOD₅, 9.8x COD, 10.7x TN, 5.5x TSS, and 7.1x TP than medium-strength municipal sewage. These multipliers set the equalization and pretreatment sizing, regardless of which downstream technology is selected.
Does MBR eliminate the need for a DAF in a poultry or red meat plant?
No. FOG at 7.1x municipal TP will foul membranes and shut down a clarifier without a DAF in front of either system. A DAF system is standard pretreatment for any Green Forest-area meat processor running CAS or MBR, and it also reduces membrane scouring energy in MBR service.