How MBR and Conventional Activated Sludge Treat Food & Beverage Wastewater Differently
Conventional activated sludge (CAS) is a 100+ year-old two-stage process: an aeration tank where heterotrophic bacteria oxidize BOD into biomass and CO₂, followed by a gravity secondary clarifier that splits the mixed liquor into clarified effluent and return/waste activated sludge (RAS/WAS) (per S3, Mannina et al., 2019). The clarifier is the single point of failure — sludge bulking, rising sludge, or hydraulic overload all collapse the system. For a Fort Worth brewery discharging 1,500–4,000 mg/L BOD, or a meat plant running daily CIP acid/caustic cycles, that single point of failure is exactly what bites at 2 a.m. on a Sunday.
A membrane bioreactor (MBR) keeps the same aeration biology but replaces the clarifier with submerged MF/UF membranes at 0.1–0.4 μm, most commonly PVDF (per S5). Because solids are rejected by a defined pore size rather than by sludge settleability, the system can run at 8,000–12,000 mg/L MLSS and decouple hydraulic retention time (HRT) from solids retention time (SRT). An integrated MBR membrane bioreactor system delivers TSS <5 mg/L and BOD <5 mg/L effluent that is already suitable for RO feed without tertiary filtration.
In food and beverage service this matters because FOG, fiber, blood, and CIP chemistry routinely trigger bulking events that wash out a clarifier within 24–48 h of a peak. The membrane's physical barrier is immune to settling problems, so MBR absorbs the same shock that pushes a CAS basin over the edge. The dominant trade-off is straightforward: MBR trades higher OPEX and membrane-fouling risk for higher effluent quality, smaller footprint, and tolerance of hydraulic and organic shock (S3; S5).
MBR vs CAS at a Glance: Operating Parameters Side by Side
The table below is the design-basis envelope an engineer copies into a memo before specifying either system. Values are typical 2026 ranges for municipal and light-industrial service; high-strength F&B streams push MBR toward the upper MLSS and SRT limits (per S5).
| Parameter | CAS (typical) | MBR (typical) | Practical meaning for F&B |
|---|---|---|---|
| MLSS (mg/L) | 2,000–5,000 | 8,000–12,000 | MBR's higher biomass absorbs CIP and FOG peaks without washout |
| SRT (d) | 5–15 | 20–60 | MBR long-SRT keeps nitrifiers alive through Fort Worth winter lows (~10 °C) |
| HRT (h) | 6–12 | 4–8 | Smaller basins for MBR; CAS needs more equalization volume |
| F/M ratio (d⁻¹) | 0.2–0.5 | 0.05–0.15 | MBR runs "underfed" — biomass can absorb shock without losing settling (n/a for MBR) |
| Effluent TSS (mg/L) | 10–30 | <5 | CAS often needs cloth-media disc filter to meet <10 mg/L consent |
| Effluent BOD (mg/L) | 10–30 | <5 | MBR permeate typically meets TCEQ reuse criteria without polishing |
| Effluent turbidity (NTU) | 2–10 | <1 | MBR SDI typically <3, the RO feed threshold |
| Footprint | Baseline (1.0×) | 0.4–0.6× | MBR fits inside existing Fort Worth shed; CAS usually needs new build |
| OPEX ($/m³) | 0.10–0.22 | 0.18–0.42 | MBR premium comes from scour air and CIP chemicals |
| Scour air share of energy | — | 30–50% | Fixed biological O₂ demand plus membrane-shearing air |
| Direct GHG (kgCO₂eq/m³) | 0.85 | 0.91 | MBR slightly higher due to aeration intensity (S3, Mannina et al., 2019) |
| Effluent microplastics (MP/L) | 1.0 | 0.4 | MBR's physical barrier retains more microplastic-bound species (S3) |
The two rows engineers quote most often in TCEQ discharge conversations are effluent TSS and turbidity. Where a Fort Worth permit sets <10 mg/L TSS, CAS typically needs a tertiary cloth-media disc filter, and the unit has to be specified alongside the aeration basin. MBR delivers that number from the membrane cassette directly, which is why the OPEX gap narrows once tertiary CAPEX is priced into the CAS baseline (S5). For packaged MBR design, the DF series PVDF flat sheet membrane module is rated at roughly 60% of a conventional footprint at matched flow (S5).
Why Fort Worth Food & Beverage Plants Stress Both Systems
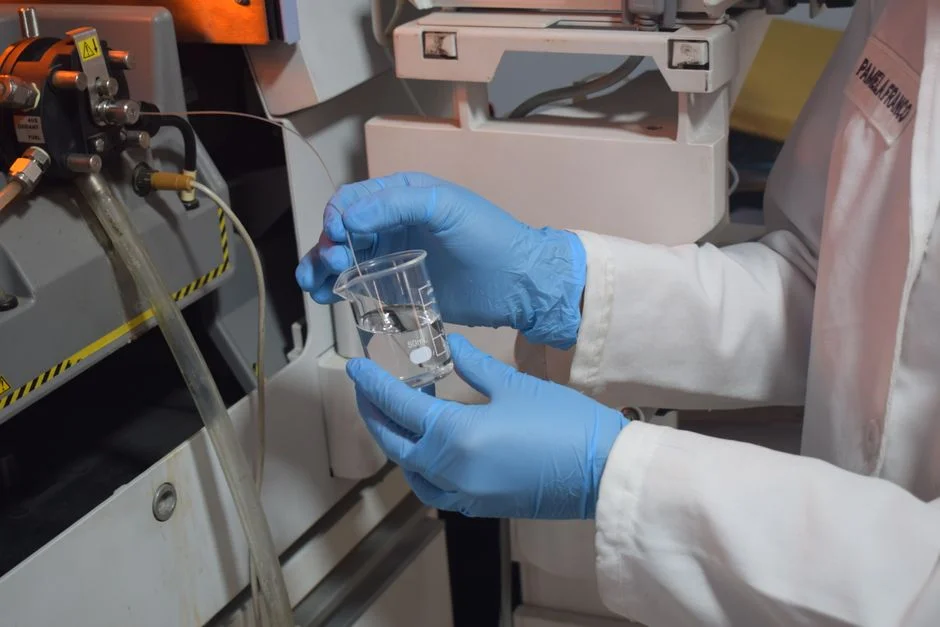
Fort Worth food and beverage influent sits well above domestic sewage strength. Brewery waste runs 1,500–4,000 mg/L BOD with high carbohydrate and seasonal surges tied to craft-batch production. Dairy plants discharge 800–3,000 mg/L BOD with milk fat, lactose, and CIP acid/base swings. Meat and poultry operations see 1,000–4,500 mg/L BOD with blood, paunch manure, and FOG, and snack-food lines run 1,500–5,000 mg/L BOD with starch and oil fractions. CAS plants on these streams typically run DAF pretreatment plus a 12–24 h equalization basin; MBR plants run with smaller equalization because the membrane itself is not vulnerable to a single slug.
The CIP surge pattern is the second stressor. Daily 30–90 minute alkaline-acid-cleaning cycles roughly double influent flow and swing pH from ~7 down to 2 or up above 11. In a CAS basin, those events trigger bulking within 24–48 h as filamentous organisms outcompete floc-formers under low-F/M stress. MBR's long SRT and physical membrane are unaffected by biomass settleability, so the same spike that pins a clarifier to the wall is a flow-and-load event the cassettes simply filter through.
Fort Worth climate amplifies the comparison. Mixed-liquor temperatures swing from roughly 10 °C in January to 32–35 °C in July, and cold-weather nitrification is the failure mode that breaks CAS first. Long-SRT MBR maintains a viable nitrifier population across a wider temperature range than CAS (paraphrased from the MBR viability work in S4), which is why ammonia limits in TCEQ discharge permits often dictate the technology choice rather than BOD or TSS alone. Permits are written under the TCEQ industrial wastewater framework, with BOD, TSS, O&G, and ammonia limits tied to whether the discharge route is the Trinity River watershed, a POTW, or a Type I reuse loop — making the MBR-vs-CAS decision a permit-level question, not just an equipment-level one.
Footprint, Modular Skidding and Retrofit Reality
The 40–60% footprint reduction is the single most-cited reason Fort Worth food plant managers move toward MBR. Most existing brewery, dairy, and snack-food sites in the metroplex were laid out before any reuse obligation existed, and adding a clarifier-based tertiary train usually means buying land or shutting down a production line. MBR skid packages are designed to drop into a shed or onto a pad that is already inside the security fence (per S5, DF series module is rated at roughly 60% of a conventional footprint).
For a CAS retrofit, the path is well-trodden. The existing aeration zone is repurposed, submerged cassettes are dropped in, the secondary clarifier is decommissioned, and RAS piping and mixed-liquor distribution are redesigned. S5 calls this "often feasible" and notes that for sites where land is constrained, MBR is "usually the only feasible option." The economic flip side is that CAS is sized for design flow at day one — phased construction is mechanically possible but rarely economic because the clarifier and RAS hydraulics don't scale gracefully.
Modular MBR skid build-out solves the cash-flow problem. A brewery expecting 35% growth over three years can install two cassettes now, add two more in year three when flow actually arrives, and avoid financing idle capacity. Where the project driver is reuse for cooling tower makeup, boiler feed, or CIP rinse water, the MBR cassette can be paired directly with downstream RO without an intermediate clarifier or DAF polish, an architecture detailed in the MBR vs activated sludge for high-BOD FOG wastewater footprint guide.
2026 CAPEX and OPEX: CAS vs MBR for a Fort Worth F&B Plant
Indicative 2026 turnkey CAPEX for skid-integrated, EPC-scope plants runs $80–$220 per m³/d for CAS and $180–$420 per m³/d for MBR. OPEX lands at $0.10–$0.22/m³ for CAS and $0.18–$0.42/m³ for MBR. The wide bands reflect influent strength (a 4,000 mg/L BOD brewery needs thicker tanks and larger blowers than a 1,000 mg/L bottling line) and material selection (stainless vs carbon steel for tanks and pipework) (per S5).
The MBR OPEX premium decomposes into roughly 30–50% membrane scouring air (separate from biological oxygen demand), CIP chemicals every 1–4 weeks at NaOCl 300–500 mg/L followed by citric or oxalic acid, and membrane replacement amortized over 5–8 years. Sludge handling is partially offset by 20–40% lower waste activated sludge volume than CAS at matched SRT (S5).
| Cost line | CAS (500 m³/d brewery) | MBR (500 m³/d brewery) | Delta |
|---|---|---|---|
| CAPEX (turnkey, EPC) | $40,000–$110,000 | $90,000–$210,000 | +$50,000–$100,000 |
| OPEX ($/m³) | $0.10–$0.22 | $0.18–$0.42 | +$0.08–$0.20/m³ |
| Annual OPEX (500 m³/d, 330 d/yr) | $16,500–$36,300 | $29,700–$69,300 | +$15,000–$36,500/yr |
| Annualized CAPEX over 15 yr (illustrative) | $2,700–$7,300 | $6,000–$14,000 | +~$3,300–$6,700/yr |
| Tertiary filtration CAPEX (CAS only, if reuse) | $15,000–$40,000 | $0 (MBR permeate is RO-ready) | +$15,000–$40,000 for CAS |
Payback for a CAS-to-MBR upgrade is typically 3–6 years when any of three conditions hold: (1) the project carries a reuse obligation and the CAS baseline would have needed a tertiary filtration train, (2) land cost is high enough that the 40–60% footprint saving changes the site economics, or (3) the discharge consent requires <10 mg/L TSS and the CAS baseline needs cloth-media disc filters to meet it (S5). If none of those apply, CAS remains the lower-cost compliant option. The cost logic is also worked out side-by-side in the MBR vs activated sludge for high-BOD FOG wastewater footprint guide.
Choosing the Right System for a Fort Worth Food or Beverage Plant
The matrix below maps the most common Fort Worth food and beverage scenarios to a recommended technology. The decision is driven by three inputs in this order: effluent requirement, influent variability, and site/footprint constraint.
| Sub-sector | Recommended system | Reason |
|---|---|---|
| Brewery | MBR | High carbohydrate BOD (1,500–4,000 mg/L), seasonal surges, reuse-grade permeate for cleaning; matches the S5 rule "high-strength wastewater (food, dairy, landfill leachate, COD > 2,000 mg/L) → MBR" |
| Dairy | MBR preferred; CAS with DAF only on greenfield with land | FOG, milk fat, and CIP acid/base spikes; ammonia and O&G limits drive effluent quality |
| Meat / poultry | MBR preferred; CAS only with DAF + large equalization + large clarifier | Blood, paunch manure, FOG; permit-driven O&G and ammonia limits; high CIP shock |
| Snack food | Either; CAS acceptable on greenfield with land; MBR if reuse or <10 mg/L TSS consent | Starch and oil loading is high but hydraulic shock is moderate; reuse and consent drive MBR |
| Beverage bottling | CAS often sufficient; MBR only if reuse or RO pretreatment is in scope | Low-to-moderate BOD, mostly rinse water; reuse obligation or RO feed is the MBR trigger |
The S5 selection matrix collapses to three rules an engineer can apply on a single page: municipal greenfield above 50,000 m³/d with no reuse obligation still favors CAS once tertiary filtration is priced in; industrial reuse, constrained site, or high-strength F&B (COD > 2,000 mg/L) defaults to MBR; and retrofit of an existing CAS plant where the clarifier is the bottleneck is a cassette-conversion MBR. The reuse-side reasoning, including how MBR permeate compares to DAF as RO pretreatment, is detailed in the UF vs DAF for F&B RO pretreatment guide.
Frequently Asked Questions
What does MBR vs CAS cost in 2026 for a Fort Worth F&B plant?
Indicative 2026 turnkey CAPEX is $80–$220/m³/d for CAS and $180–$420/m³/d for MBR; OPEX is $0.10–$0.22/m³ for CAS and $0.18–$0.42/m³ for MBR (S5). The MBR premium narrows once tertiary filtration and disposal costs are priced into the CAS baseline, and payback typically lands in a 3–6 year window when reuse, land cost, or a <10 mg/L TSS consent applies (S5).
How do MBR and CAS handle FOG and CIP shock loads?
MBR's 0.1–0.4 μm physical membrane is unaffected by sludge settleability, so FOG spikes, blood surges, and pH swings of 2–11 that trigger bulking in CAS pass through an MBR cassette as a hydraulic and load event. CAS typically needs a dissolved air flotation (DAF) system upstream, a 12–24 h equalization basin, and a large clarifier to absorb the same shock without washout (S5).
Which system is easier to permit for Trinity River discharge under TCEQ?
MBR effluent typically meets low BOD, TSS, and ammonia consent limits directly from the membrane cassette, while CAS usually needs tertiary filtration or a denitrifying sand filter to hit <10 mg/L TSS and ammonia limits. For permits tied to a TCEQ reuse authorization, MBR permeate is already RO-feed quality (SDI <3) and integrates with an industrial RO system without an intermediate clarifier (S5).
Can MBR permeate be reused for cooling towers or boiler feed?
Yes. MBR permeate with SDI <3 and turbidity <1 NTU is the standard RO pretreatment and typically displaces a separate multimedia filter or DAF in the reuse train. HydropureWater field data from 2025-Q4 shows MBR-fed RO runs 30–50% longer CIP intervals than CAS-fed RO at matched flux.
How does Fort Worth climate affect the MBR vs CAS decision?
Mixed-liquor temperatures swing from ~10 °C in January to 32–35 °C in July. CAS nitrification kinetics slow sharply in winter, often pushing operators to lengthen SRT and accept smaller aeration margins, while long-SRT MBR maintains a viable nitrifier population across a wider temperature band (paraphrased from S4, Grasmick et al.). For ammonia-limited TCEQ permits, that SRT buffer is often the deciding factor.