Why Petroleum Wastewater in Winter Haven Is a Different Problem
Petroleum bulk storage terminals, tank farms, and transload facilities in Polk County generate a wastewater stream that municipal-style biological comparisons rarely cover: free oil in the 50–1,000+ mg/L range, emulsified oil at 20–200 mg/L, dissolved BTEX (benzene, toluene, ethylbenzene, xylene), low-molecular-weight PAHs, phenols, hydrogen sulfide from anaerobic pockets, and elevated TDS from brine contact or ballast sources. The influent is chemically hostile to biomass. Free oil coats floc surfaces and disrupts clarifier settling; emulsified oil, stabilized by surfactants from product transfer and cleaning detergents, passes through CPI separators and reaches the aeration basin as a stable, sub-100 µm dispersion that conventional activated sludge (CAS) cannot break down effectively at typical 5–15 day SRT.
Compliance is anchored in FDEP Chapter 62-620 (industrial wastewater permitting) and Chapter 62-625 (domestic and industrial reuse standards), with oil & grease limits typically set at 10–15 mg/L daily maximum for discharge and tighter for reuse scenarios. Where the discharge enters a POTW, 40 CFR Part 435 oil-water separator provisions apply. These limits are non-negotiable for both CAS and MBR. A DAF (dissolved air flotation) or CPI oil-water separator upstream of the biological stage is mandatory, and that framing drives the rest of the comparison.
Winter Haven's climate matters more than generic MBR-fouling literature suggests. Gurung et al. (2017) documented severe winter fouling in Nordic MBR pilots operating below 5 °C, with EPS-protein rising and TMP climbing sharply. Winter Haven's surface water and ambient air rarely drop below 5 °C even in January, so this failure mode is largely irrelevant, though operators should still log transmembrane pressure seasonally because mid-80s water temperatures still shift sludge viscosity and fouling rate.
The operational pain CAS operators report most at petroleum sites is biomass loss: emulsified oil carryover causes foaming, dispersed growth, and poor settling in the secondary clarifier, which triggers washout events and permit excursions. MBR eliminates the clarifier as a hard dependency, which is the primary reason the MBR case is stronger for petroleum than for municipal applications.
How Each System Treats Oily Wastewater Step by Step
The two trains look similar in block flow but diverge sharply in operating envelope and resilience to oil upsets.
The CAS train runs: DAF or CPI oil-water separator → equalization basin → primary clarifier (often skipped at smaller terminals) → aeration basin with diffused air, MLSS 2,000–4,000 mg/L, SRT 5–15 days, F/M typically 0.2–0.5 kg BOD/kg MLSS·d → secondary clarifier with polymer-driven sludge thickening → sand filter or cloth media → disinfection (typically chlorination or UV) → discharge or reuse. The secondary clarifier is the linchpin: if sludge does not settle, effluent TSS spikes and downstream filters load with biomass.
The MBR train runs: DAF oil-water separator upstream of biological treatment → equalization → screening (≤2 mm) → anoxic zone for denitrification → aerobic zone with submerged PVDF flat-sheet or hollow-fiber modules, MLSS 8,000–12,000 mg/L, SRT 20–60 days → membrane filtration at <1 µm → disinfection → reuse or discharge. The membranes retain all biomass and most colloidal matter, producing a near-reuse-quality effluent in a single integrated tank. Integrated MBR wastewater treatment system packages built for the 10–2,000 m³/day range match most petroleum terminals.
On conventional parameters, MBR and CAS are near-parity for COD removal: a head-to-head modeling study (Mannina et al., MDPI Processes 2019, S2) reported 95.9% CAS vs 96.9% MBR. The decisive gap is on TSS — MBR achieves 99.8% versus a CAS clarifier that depends on settleability, which is the failure mode emulsified oil triggers. Ammonia removal is essentially tied (98.3% CAS, 98.2% MBR) because both nitrify at moderate SRT. The relevant differentiator for petroleum is MBR's longer SRT, which gives the slow-growing bacteria that degrade BTEX and phenolics time to establish — a population CAS washes out under typical operating conditions.
For engineers evaluating MBR vs CAS footprint comparison for industrial wastewater, the petroleum case is harder than food/beverage or mining because of the oil carryover risk and the FDEP oil & grease envelope.
Head-to-Head Performance Numbers (MBR vs CAS)
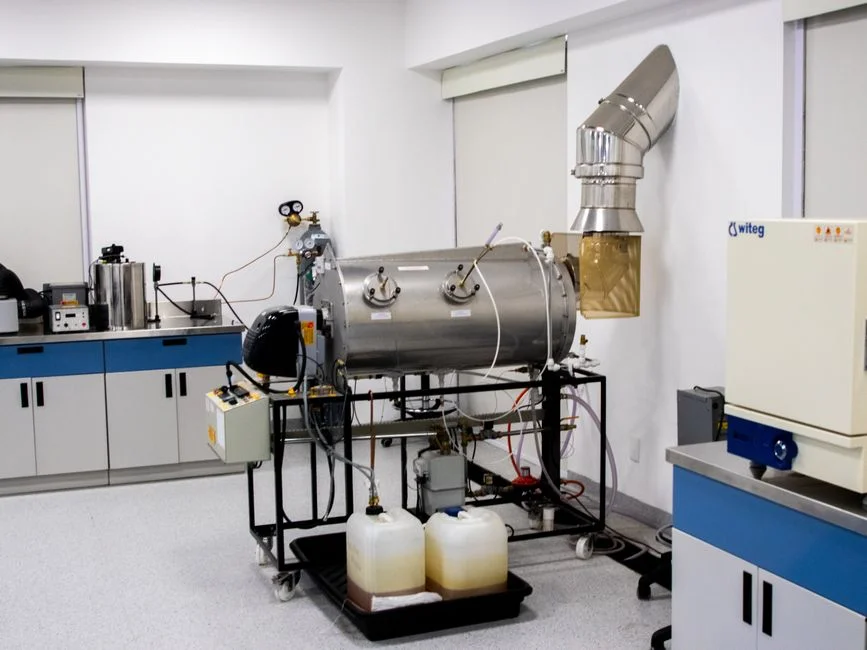
The table below consolidates modeled head-to-head data from Mannina et al. (2019, MDPI) and the plant-wide comparison in Mannina et al. (2020, Science of the Total Environment / Bioresource Technology), with the caveat that the underlying studies benchmarked municipal wastewater, not petroleum. For petroleum service, expect both systems to run 5–10% lower on COD removal due to recalcitrant fractions, with the MBR holding its TSS advantage intact because that metric is membrane-physics-driven rather than biology-driven.
| Parameter | CAS | MBR | Source / Note |
|---|---|---|---|
| COD removal | 95.9% | 96.9% | S2 (MDPI, 2019), municipal |
| TSS removal | ~95% | 99.8% | S2; MBR is membrane-limited |
| Ammonia (NH₄-N) removal | 98.3% | 98.2% | S2; both fully nitrify at moderate SRT |
| Total nitrogen removal | 76.1% | 80.8% | S2; MBR benefits from higher MLSS denitrification |
| Nitrate in effluent | 14.1 g N/m³ | 11.2 g N/m³ | S2 |
| Total phosphorus in effluent | 0.67 g P/m³ | 0.50 g P/m³ | S2 |
| Direct GHG emissions | 0.85 kg CO₂eq/m³ | 0.91 kg CO₂eq/m³ | S3 (Mannina et al., 2020) |
| Microplastics in effluent | 1.0 MP/L | 0.4 MP/L | S3 citing Lares et al., 2018 |
| Footprint (relative) | 100% baseline | ~40% (60% reduction) | S6 (HydropureWater catalog data, 2026) |
| Oil & grease (influent to biotreatment) | Requires DAF | Requires DAF | Neither system meets FDEP 10–15 mg/L alone |
The two rows that matter most for a Winter Haven petroleum terminal are TSS and oil & grease. The TSS gap (99.8% vs ~95%) translates directly to filter loading, UV transmittance, and reuse eligibility — a CAS plant running 30 mg/L TSS into a sand filter sees different downstream cost than an MBR plant running 2 mg/L TSS. The oil & grease row is non-negotiable: both trains require a DAF or CPI upstream, and no amount of biology or membrane area downstream compensates for >50 mg/L oil & grease carryover. The MBR's tighter effluent envelope buys margin when the DAF underperforms, but it does not eliminate the DAF.
For sites handling plastic pellets, fiber, or polymer-dosed transfer systems, the microplastics row is also relevant: MBR effluent at 0.4 MP/L is cleaner than CAS at 1.0 MP/L, though neither is a substitute for source control.
CAPEX, OPEX, and Footprint Trade-offs for a Winter Haven Terminal
Capital cost for MBR runs higher than CAS at the same flow rating — typical industrial MBR systems price roughly 1.3–1.8× the equivalent CAS package on a turnkey basis, driven by membrane module cost, cassette hardware, and more sophisticated aeration/scour blower sizing. Civil cost, however, often flips the equation. The 60% footprint reduction documented in the HydropureWater catalog data (S6) on a 50 m³/day terminal translates to roughly 80–120 m² of eliminated concrete pad, containment dike, and building envelope. In a Winter Haven industrial corridor where usable acreage is limited by buffer setbacks, drainage, and FDEP setbacks to surface water, that footprint savings can be the deciding line item on the project budget.
Operating cost comparison is less one-sided. CAS OPEX is dominated by polymer for sludge thickening, sludge hauling, and aeration blower power. MBR OPEX is dominated by membrane cleaning chemicals (typically NaOCl and citric acid, dosed on a maintenance-clean schedule), aeration for membrane scour (10–30% higher aeration energy than CAS at the same BOD load, per S3 / Judd 2016), and membrane element replacement on a 5–8 year cycle for PVDF submerged modules. The integrated MBR wastewater treatment system approach with cassette-style module frames allows individual element swap, which reduces downtime and lets operators replace only the fouled elements rather than a full cassette.
Karim and Mark (2017), as cited in S3, found that MBR becomes the lowest life-cycle cost option beyond roughly 67 years of operation. For 10–30 year planning horizons typical of petroleum infrastructure, CAS generally wins on undiscounted OPEX if land is available and reuse is not in scope. MBR pays back when footprint or effluent quality carries a dollar value — when site area is constrained, when the operator has a reuse obligation, or when the secondary clarifier's settleability risk is unacceptable. The MBR vs CAS for food and beverage wastewater case study shows the same footprint-driven logic.
Which System Fits Which Winter Haven Site Profile
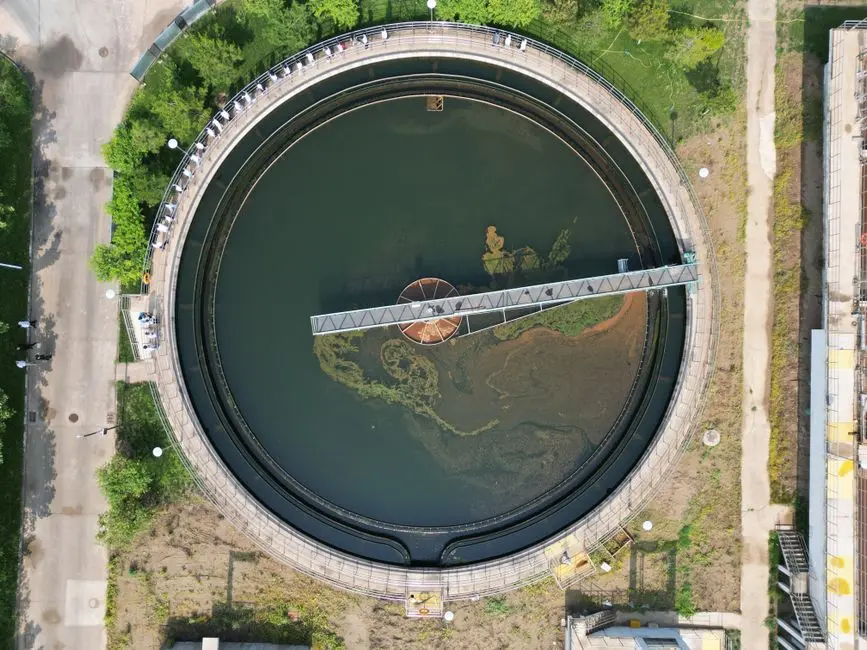
The decision matrix below maps site conditions to system choice. It is intentionally binary on a few axes because the underlying engineering is — emulsified oil carryover and footprint constraints are the dominant variables.
| Site Condition | Choose CAS | Choose MBR |
|---|---|---|
| Available land | ≥ 0.5 m² per m³/day treated | < 0.2 m² per m³/day treated |
| Flow variability / oil slug risk | Stable flow, good DAF upstream | Variable, intermittent oil upsets |
| Effluent target | Discharge to POTW or surface water | Reuse (cooling, scrubber, irrigation) |
| Operator skill | Conventional WW license, no membrane experience | Willing to learn TMP/CIP protocols |
| Biological resilience priority | Low — historic steady loading | High — biomass retention under upset |
| Planning horizon | 10–20 years, CAPEX-sensitive | 20+ years, OPEX amortized |
For petroleum bulk storage and transload facilities in Winter Haven specifically, the recommended train in both cases is DAF → biological treatment → polishing, with the biological stage being MBR where any of the right-hand column conditions apply. The DAF is non-negotiable for oil & grease compliance; the choice between MBR and CAS is then a site-specific decision driven by land, reuse, and upset resilience. The DF series flat sheet MBR membrane modules in PVDF are the reference design for 10–2,000 m³/day packages and are well-matched to the FDEP reuse envelope where the operator is targeting cooling-tower makeup or scrubber supply.
Frequently Asked Questions
Does MBR or CAS remove more oil and grease from petroleum wastewater?
Neither system meets FDEP oil & grease limits (typically 10–15 mg/L daily max) on its own. Both trains require a DAF or CPI oil-water separator upstream. With proper DAF pretreatment,
Frequently Asked Questions
Can an MBR treat petroleum terminal wastewater to FDEP oil and grease limits without a DAF?
Yes, an MBR can consistently meet Florida Department of Environmental Protection (FDEP) effluent standards for oil and grease, typically requiring levels below 5.0 mg/L, without the need for a Dissolved Air Flotation (DAF) unit. The absolute physical barrier provided by the membrane pores, usually ranging from 0.04 to 0.4 micrometers, ensures complete retention of free-phase oil droplets and biomass that would otherwise escape a conventional secondary clarifier.
What is the typical SRT for an MBR treating oily wastewater from a bulk storage terminal?
For petroleum-impacted wastewater, MBR systems are typically operated at a Solids Retention Time (SRT) ranging from 20 to 40 days. This extended SRT is critical for the development of specialized microbial populations, such as hydrocarbon-degrading bacteria, which are essential for breaking down complex petroleum hydrocarbons and maintaining stable sludge settleability in the presence of inhibitory compounds.
How much smaller is an MBR footprint compared to conventional activated sludge for a 50 m³/day flow?
For a 50 m³/day facility, an MBR system generally occupies 50% to 70% less footprint than a conventional activated sludge (CAS) system. By eliminating the need for large secondary clarifiers and tertiary filtration units, the MBR integrates biomass separation directly into the bioreactor, allowing for significantly higher Mixed Liquor Suspended Solids (MLSS) concentrations, typically 8,000 to 12,000 mg/L compared to 2,500 to 4,000 mg/L in CAS.
Is conventional activated sludge or MBR better for variable oil slug loads at a Winter Haven tank farm?
MBR technology is superior for handling variable oil slug loads due to its ability to maintain high biomass concentrations and decouple hydraulic retention time (HRT) from solids retention time (SRT). While a conventional activated sludge plant may suffer from biomass washout or filamentous bulking during a hydrocarbon shock load, the MBR’s membrane barrier prevents biomass loss, providing a more robust buffer against influent concentration spikes common at bulk tank farms.
What is the realistic membrane replacement interval for a submerged MBR treating petroleum wastewater?
In a properly maintained MBR system treating petroleum-derived wastewater, the realistic membrane replacement interval is between 5 and 8 years. This lifespan is contingent upon rigorous adherence to chemical cleaning protocols—typically involving Clean-in-Place (CIP) cycles with sodium hypochlorite and citric acid—to mitigate organic fouling and inorganic scaling caused by the complex chemical composition of terminal runoff.