
Why the Brownfield Footprint, Not the Biology, Drives the Choice
A 1990s conventional activated sludge plant at a 1,000 m³/day flotation tail water reuse target in Crystal Springs, Mississippi usually arrives at a Monday review with a fixed rectangle drawn by an existing aeration basin, one or two secondary clarifiers, and a bund wall that will not move. The biological question — "can the mixed liquor treat this feed?" — is almost always answerable. The real question is whether a new technology can fit inside the existing civil envelope, hit MDEQ's tightening metals limits on the Tombigbee basin, and still feed a downstream RO loop for grinding dilution. Industries consume roughly 22% of the global water supply and up to 60% in high-income economies, with mining among the heaviest per-tonne users (npj Clean Water 2022). On a Mississippi brownfield, the binding constraint is the square metres an older CAS plant leaves behind, not the cubic metres of treatable flow. For an MBR-and-DAF front end on a similar flow envelope, the engineering trade-offs are laid out in this 2026 comparison of DAF vs clarifier for mining wastewater on a comparable brownfield retrofit. Reframing the decision around civil footprint and reuse, rather than biology, is what gets the project through the CAPEX committee and an MDEQ permit review with defensible numbers.
Crystal Springs Mining Influent: TDS, Reagents and Metals Profile
Flotation tail water in the Tombigbee basin routinely sits in a 0.5–5% TDS band (5,000–50,000 mg/L) on concentrators that already recycle process water and pull brackish makeup from the local aquifer (HydropureWater mining MBR field data, 2026). That is the envelope any upgrade has to survive. The same feed carries residual flotation reagents — potassium ethyl xanthate at 5–20 mg/L, dithiophosphate (DTP) collectors, and frothers such as MIBC or pine oil — plus dissolved Pb, Zn, Cu, and Cd at concentrations set by ore body and reagent scheme. Industrial wastewater in this class typically runs 1–200 g/L organic strength, non-neutral pH, variable temperature and salinity, and high heavy-metal content (npj Clean Water 2022), which is why a single unit operation cannot carry the load. CAS at 5–10 day SRT will not biologically destroy xanthate or DTP at meaningful rates; MBR at 30+ day SRT will, and the high-MLSS biomass also biosorbs dissolved metals when pH is held at 6.5–7.5. The combined feed sets the membrane selection window: flat-sheet PVDF handles 500–5,000 mg/L influent TSS at flux 15–25 L/m²·h, while hollow-fiber wins only when the upstream is already pre-filtered to under 100 mg/L TSS. For the upstream metal-precipitation stage, a properly sized automatic chemical dosing system is the typical hardware paired with a DAF or pH-adjustment train on a Mississippi feed.
MBR vs CAS: Side-by-Side Engineering Parameters
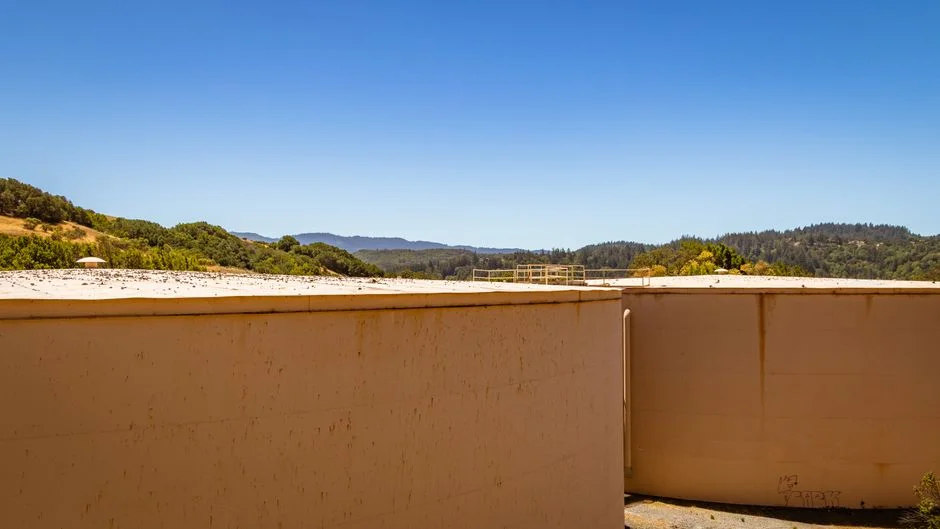
An MBR runs at 8,000–12,000 mg/L mixed liquor suspended solids versus 2,000–4,000 mg/L for CAS, and that single ratio is the largest physical difference between the two technologies — it eliminates the secondary clarifier, shrinks the aeration basin for a given F:M ratio, and roughly 60% of equivalent CAS footprint on a 1,000 m³/day train (HydropureWater integrated MBR field data, 2026). Effluent TSS reflects the same physics: MBR permeate sits below 1 mg/L because the UF membrane is an absolute barrier, while a well-run secondary clarifier with polymer aid still discharges 5–15 mg/L TSS. Heavy-metal removal lands at 70–95% in an MBR (biosorption on the cake layer plus bioaccumulation inside the biomass) versus 30–60% in CAS at the same biology (HydropureWater mining MBR field data, 2026). Reagent removal is the most operationally important gap: MBR strips 85–95% of xanthate and DTP down to under 1 mg/L, while CAS at 5–10 day SRT leaves 2–4 day half-life residuals. Aeration is the largest MBR OPEX line at 36–68% of total, dominated by coarse-bubble scour across flat-sheet modules, which runs 10–20× lower than the membrane-aeration energy of external cross-flow configurations (Global NEST 2022; HydropureWater 2026).
| Parameter | CAS (Conventional Activated Sludge) | MBR (Integrated Membrane Bioreactor) |
|---|---|---|
| MLSS | 2,000–4,000 mg/L | 8,000–12,000 mg/L |
| SRT | 5–10 days | 30+ days |
| Effluent TSS | 5–15 mg/L (with polymer) | <1 mg/L (UF absolute barrier) |
| Heavy-metal removal (Pb, Zn, Cu, Cd) | 30–60% | 70–95% (biosorption + bioaccumulation) |
| Xanthate / DTP removal | Limited (2–4 day residuals) | 85–95% (permeate <1 mg/L) |
| Aeration share of OPEX | 30–45% | 36–68% (coarse-bubble flat-sheet) |
| Membrane area per 1,000 m³/day | N/A | 1,800–3,200 m² (DF series cassettes) |
| Footprint at 1,000 m³/day | Baseline | ~60% of CAS footprint |
| Installed CAPEX per m³/day (2026) | USD 550–1,700 (with tertiary filter) | USD 800–2,500 (mining grade) |
For a 1,000 m³/day flotation tail water train, the integrated MBR wastewater treatment system sized to 500–10,000 m³/day is the configuration that delivers those numbers without civil expansion. CAS CAPEX is 30–50% lower on a membrane-free basis, but that comparison assumes the site reuses existing clarifier volume and does not need a tertiary media filter ahead of any downstream RO. Once those civil and polishing items are priced in, the gap narrows quickly. The same footprint argument — biology is rarely the constraint, civil is — is documented in the parallel 2026 footprint guide for MBR vs conventional activated sludge for pharma wastewater duty.
The Three-Stage Train: DAF Upstream, RO Downstream, ZLD Optional
Technology choice between MBR and CAS is rarely made in isolation; it is the middle of a three-stage train, and the upstream and downstream stages are nearly identical for both options. A dissolved air flotation unit in the 4–300 m³/h range upstream of the biological step removes 60–80% of influent oil and 30–50% of TSS, extending MBR cleaning intervals from weekly to monthly and cutting CIP chemical consumption by 50–70% (HydropureWater 2026). The same DAF protects a CAS clarifier from sludge loss during shock loads, so the upstream choice does not move the needle between the two technologies. The downstream stage does. MBR permeate at 5,000–20,000 mg/L TDS is the correct feed for a brackish-water RO system running at 70–85% recovery, with industrial RO permeate below 500 mg/L TDS suitable for grinding dilution water or heap-leach makeup. CAS effluent at 5–15 mg/L TSS typically needs an additional sand or multimedia filter before the RO to protect the membranes from fouling, and that filter partially erodes the CAS footprint advantage. For zero-liquid-discharge (ZLD) finishing, RO concentrate at 30,000–60,000 mg/L TDS feeds an evaporator or crystallizer, and this final stage is technology-agnostic between MBR and CAS.
2026 CAPEX, OPEX and 10-Year Lifecycle for a 1,000 m³/day Train
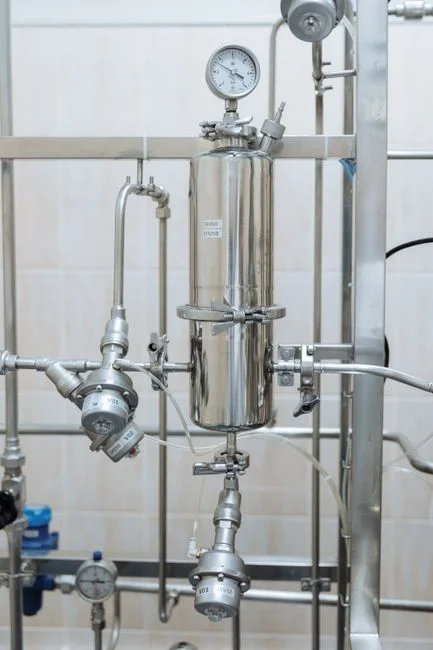
Total installed MBR CAPEX in 2026 for a mining-grade train runs USD 800–2,500 per m³/day of capacity for flows in the 500–10,000 m³/day range, with the wide spread driven by influent variability, seismic class, automation scope, and containerized versus skid build (HydropureWater mining MBR field data, 2026). A CAS upgrade on the same throughput is 30–50% lower on a membrane-free basis but adds clarifier civil works, polymer dosing skids, and a tertiary media filter ahead of any RO, which closes roughly half of the gap on a fully-loaded basis. Aeration is the dominant MBR OPEX line at 36–68% of total, and flat-sheet submerged modules cut this 10–20× versus external cross-flow (Global NEST 2022). On a 10-year view, MBR typically wins on reduced clarifier civil, eliminated tertiary media filter replacement, and lower polymer consumption; CAS wins when the operator pool cannot sustain membrane CIP discipline. The DF series flat-sheet MBR membrane module at 32–135 m³/day per cassette is the right building block for 500–10,000 m³/day mining duty, and the lifecycle math below assumes that geometry.
| Cost line (10-year, 1,000 m³/day, USD) | CAS + tertiary filter + RO | Integrated MBR + RO |
|---|---|---|
| Installed CAPEX (2026) | USD 1.0–1.7M | USD 0.8–2.5M |
| Clarifier civil / rebuild (yr 0–3) | USD 200–400k (refurbish) | USD 0 (eliminated) |
| Membrane replacement (yr 5–7) | USD 0 | USD 250–500k |
| Aeration energy (10 yr, electricity) | USD 600–900k | USD 800k–1.2M |
| Polymer + CIP chemicals (10 yr) | USD 250–400k | USD 80–150k |
| Tertiary media filter media (yr 3, 6, 9) | USD 120–200k | USD 0 (membrane barrier) |
| 10-year lifecycle envelope | USD 2.2–3.6M | USD 1.9–4.3M |
The lifecycle envelopes overlap, which is why the decision must hinge on the operator CIP pool, the downstream RO scope, and the MDEQ-driven metals target — not on membrane CAPEX alone.
Five-Step Selection Checklist for a Monday-Morning Review
- Confirm the binding civil constraint. Measure the existing clarifier area, the aeration basin volume, and the rectangle the new technology must fit inside. If there is room for a second clarifier and flow is not growing, CAS retrofit is on the table; if not, MBR's ~60% footprint win is the only path.
- Map influent chemistry against permits. Plot TDS, xanthate, DTP, and dissolved Pb/Zn/Cu/Cd against MDEQ metals limits and 40 CFR 436 ore mining effluent guidelines. Anything above 70% metal removal, or residual reagent below 1 mg/L, points to MBR.
- Decide whether downstream RO is in scope. If yes, MBR permeate is the correct feed for a 70–85% recovery BWRO. If no, the MBR TSS advantage is wasted on a polishing pond or controlled discharge.
- Pick module geometry from feed TSS. Flat-sheet PVDF for 500–5,000 mg/L TSS influent with monthly CIP; hollow-fiber only when upstream is pre-filtered to under 100 mg/L TSS. Mining duty defaults to flat-sheet.
- Audit the operator pool for membrane CIP training. Unplanned membrane replacement from poor CIP discipline can dwarf the 36–68% aeration OPEX share. If CIP discipline is not sustainable, the lifecycle verdict flips back to CAS even when the chemistry favors MBR.
The same five-step logic, applied to a higher-strength industrial envelope, is the framework in the 2026 MBR vs activated sludge for high-BOD FOG wastewater footprint guide.
When CAS Is Still the Correct Call
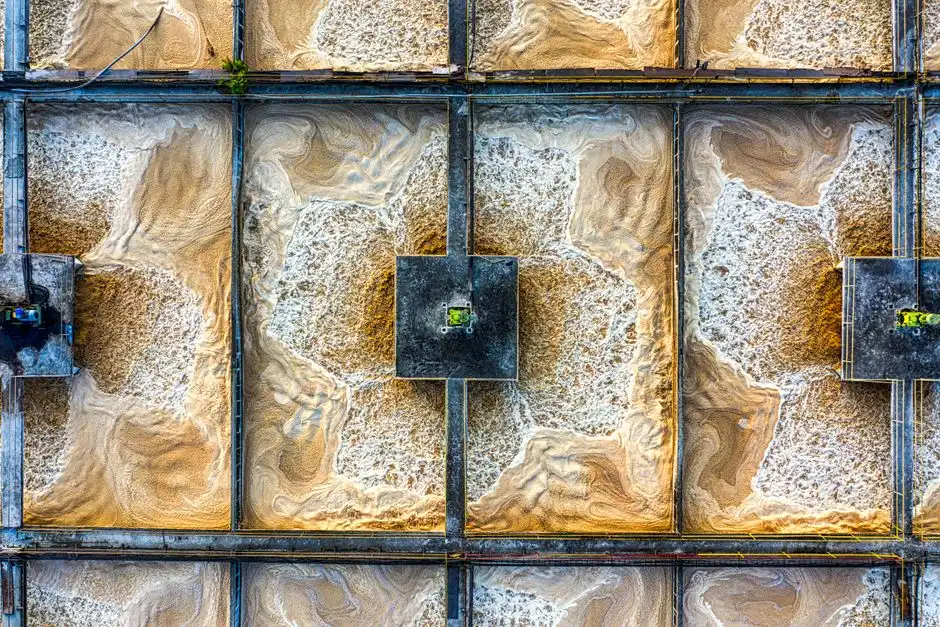
There are four recurring scenarios where CAS remains the right answer on a Mississippi brownfield, and an honest 2026 guide has to name them. First, when existing clarifier volume has 20+ years of remaining service life and no flow increase, re-rastering the aeration basin to an MBR is hard to justify on CAPEX alone. Second, when influent TDS sits under 5,000 mg/L and there is no closed-loop reuse target, the heavy-metal and reagent removal advantages of MBR are not yet needed and a well-tuned CAS will meet the discharge consent. Third, when the operator pool has no membrane CIP training, the 36–68% aeration share of MBR OPEX is dwarfed by the cost of unplanned membrane-replacement events from poor CIP discipline. Fourth, when there is no RO polishing downstream, the under-1 mg/L MBR TSS advantage is wasted because the effluent is going to a polishing pond or a controlled discharge rather than back into the process. In any of these four scenarios, upgrading the existing CAS — adding a selector zone, fine-bubble diffusers, and a polymer dosing skid — delivers more value per dollar than a greenfield MBR.
Frequently Asked Questions
How much smaller is an MBR footprint than CAS at 1,000 m³/day flotation tail water?
An integrated MBR occupies roughly 60% of the footprint of an equivalent CAS train at the same throughput, primarily because the 8,000–12,000 mg/L MLSS operating range eliminates the large secondary clarifiers CAS requires (HydropureWater integrated MBR field data, 2026).
Can an MBR alone meet MDEQ metals limits on Tombigbee basin discharge?
Not always. MBR delivers 70–95% dissolved Pb/Zn/Cu/Cd removal at pH 6.5–7.5, but for TDS below 500 mg/L — required for grinding reuse or for surface discharge under most 2026 mining-jurisdiction limits — a brackish-water RO must follow the MBR (HydropureWater mining MBR field data, 2026).
What 2026 CAPEX should a CAPEX committee expect for a 1,000 m³/day MBR train in Mississippi?
USD 800–2,500 per m³/day of installed capacity for a mining-grade MBR in the 500–10,000 m³/day envelope, with the spread driven by influent variability, seismic class, automation scope, and containerized versus skid build (HydropureWater mining MBR field data, 2026).
Does MBR actually destroy xanthate and DTP that CAS leaves behind?
Yes. A properly sized MBR running at 10,000 mg/L MLSS and 30+ day SRT removes 85–95% of residual xanthate and DTP, reducing potassium ethyl xanthate from 5–20 mg/L in the feed to below 1 mg/L in the permeate (HydropureWater mining MBR field data, 2026).
When does CAS still win over MBR on a Mississippi mining site?
CAS still wins when the site has existing clarifier volume with 20+ years of service life remaining, influent TDS stays under 5,000 mg/L, there is no downstream RO polishing, and the operator pool has no membrane-CIP training (HydropureWater mining MBR field data, 2026).