Why Metals-Laden Process Water Breaks a Standard MBR-vs-MBBR Comparison
Municipal wastewater benchmarks do not transfer to a copper, zinc, gold, or steel mill. Metals-plant influent typically carries high total dissolved solids (TDS), hardness above 500 mg/L as CaCO3, free Cu/Zn/Ni in the 5–50 mg/L range, and iron or manganese that oxidizes in the aeration basin. Free copper and zinc inhibit nitrifiers at 1–5 mg/L and strip biofilm from MBBR carriers, while hardness and silica scale the membrane surface faster than any municipal dataset predicts (HydropureWater field data, 2026). pH swings from 6 to 9 and metal spikes of 10× baseline are routine in flotation thickener overflow and heap-leach drainage; suspended biomass is hit harder than attached biofilm, which is why the biofilm reactor survives where activated sludge does not.
The MBR's appeal in reuse is real: micro- and ultra-porous membranes at 0.1–0.4 µm physically exclude suspended solids and can deliver 4-log virus removal (per S3), but those same membranes are the surface that calcium, silica, and oxidized iron glue shut. The decision drivers for the rest of this article are reuse turbidity target, membrane-fouling or CIP interval, and operator hours per week, with the MBR-vs-MBBR verdict varying based on these specific constraints.
How MBR Performs on Metals-Laden Water: Reuse Turbidity and Fouling Reality
An MBR delivers <1 NTU turbidity and 99%+ TSS removal. In the textile-pilot work that anchors our hybrid comparison, MBR hit 99.4% TSS removal and 91% COD removal at HRT 1.3 days (per S1). The bibliometric review reports MBR averages near 88% BOD, 84% COD, 65% TN, and 60% TP across dozens of studies (per S2) — close to the MBBR on organics, clearly ahead on nutrients, and decisively ahead on suspended solids. Submerged PVDF flat-sheet modules at 0.1 µm pore size are the workhorse for metals service, and an submerged PVDF MBR module for metals service is what most suppliers will quote for a mine-site skid.
The binding constraint in a metals plant is fouling pressure, not effluent quality. Free chlorine residual above 2 mg/L, hardness above 500 mg/L as CaCO3, and Fe/Mn oxidized in situ all accelerate cake-layer build-up; CIP every 20–40 days is the realistic operating range, not every quarter. Pre-treatment cannot be skipped: pH adjustment to the membrane supplier's limit, sulfide precipitation or hydroxide precipitation for the target metals, and a lamella clarifier upstream of MBR for metals precipitation or DAF for the colloidal fraction. Skipping the clarifier pushes the membrane's CIP interval toward the short end of that 20–40 day window and inflates OPEX (HydropureWater field data, 2026). For reuse into cooling towers or gland water, an integrated MBR system for mining process water is the cleanest specification.
How MBBR Performs on Metals-Laden Water: Operator Burden and Footprint
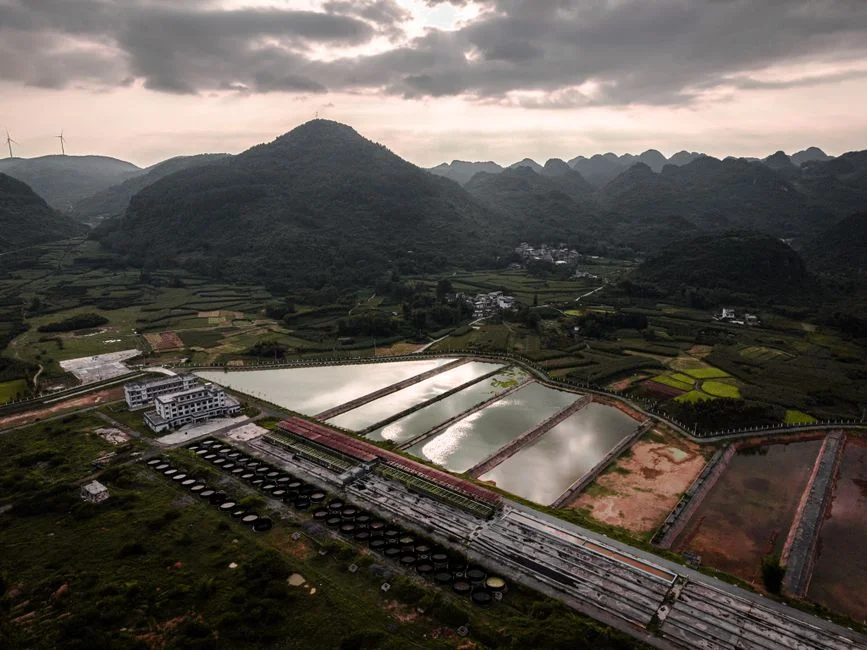
An MBBR grows biofilm on free-moving PE carriers and tolerates metal toxicity better than suspended biomass because diffusion gradients protect the inner biofilm layers from a sudden Cu or Zn spike. Removal averages from the bibliometric review are BOD 87%, COD 80.1%, TN 56%, TP 53.8% (per S2) — within a few points of MBR on organics, lower on nutrients, and adequate for discharge to most river or sewer consents. In the textile pilot, MBBR cut HRT to 1 day (half of CAS) and saved 68.4% of CAPEX with OPEX equal to MBR (per S1); translate that CAPEX delta to a metals plant and the civil and blower savings are similar because the MBBR tank is smaller and there is no membrane skid.
The operator story is where MBBR wins outright. No membrane CIP, no permeate flux loop, no critical aeration control beyond dissolved-oxygen setpoint. Routine tasks are screen cleaning, carrier inspection, and occasional top-up of carrier inventory; a single operator can run a 5,000 m3/d MBBR in roughly 5–10 hours per week of dedicated attention (HydropureWater field data, 2026). Effluent turbidity lands in the 5–30 NTU range — fine for discharge, rarely fine for direct cooling-tower reuse without downstream polishing.
Side-by-Side Parameter Comparison: MBR vs MBBR vs MBBR-MBR Hybrid
The table below consolidates the S1, S2, S3, and S5 datapoints and adds the operational parameters a metals engineer needs for a PFD note. The "Discharge" and "Reuse" columns flag which configuration fits each downstream path; the metals-service footnote reminds the reader that hardness, free metal, and shock-load assumptions must be set case-by-case.
| Parameter | MBR (standalone) | MBBR (standalone) | MBBR-MBR Hybrid (MBMBR) | Scenario Fit |
|---|---|---|---|---|
| Effluent turbidity (NTU) | <1 | 5–30 | <1 | MBR / Hybrid: reuse; MBBR: discharge |
| TSS removal (%) | 99.4 (S1) | 73 (S1) | 99 (S1) | Reuse requires MBR or Hybrid |
| COD removal (%) | 91 (S1) / 84 avg (S2) | 80.1 avg (S2) | 93 (S1) / 98 (S5) | Hybrid leads on organics |
| BOD removal (%) | 88 avg (S2) | 87 avg (S2) | ~90 (S3, S5) | All three are within 1–2 pts |
| TN removal (%) | 65 avg (S2) | 56 avg (S2) | 57 (K1, S5) / 55 (13X-H, S5) | MBR leads; Hybrid close |
| HRT (hours) | ~31 (S1) | 24 (S1) | 24 (S1, S3) | MBBR / Hybrid halve CAS |
| CAPEX index (vs MBR = 100) | 100 | ~32 (per S1, 68.4% saving) | ~70–80 (estimated, S1 LCA) | MBBR lowest |
| OPEX index (vs MBR = 100) | 100 | ~100 (S1) | ~80–90 (S1, lower CIP) | Hybrid lowest long-term |
| Operator hours/week | 15–25 (CIP, flux) | 5–10 (screens, carriers) | 10–15 (membrane + carriers) | MBBR lowest burden |
| RO pre-treatment suitability | Yes (direct) | No (needs UF) | Yes (direct) | Reuse + RO needs MBR / Hybrid |
| Time-to-total-fouling (days) | ~25–35 (HydropureWater field data, 2026) | N/A (no membrane) | 31 (control) → 43 (K1, S5) | Hybrid extends CIP interval |
Metals-service footnote: influent free Cu/Zn/Ni limits, hardness as CaCO3, Fe/Mn concentration, and shock-load frequency must be confirmed pilot-scale; the values above assume a conventional hydroxide-precipitation front end.
The Hybrid MBBR-MBR: Why 2026 Metals Plants Are Specifying Both
The hybrid MBBR-MBR — also called MBMBR or moving bed membrane bioreactor — is a biofilm tank in series with an MBR stage. The MBBR front end strips 80–93% of COD (per S1, S3) and a large fraction of suspended solids before mixed liquor ever reaches the membrane, so the membrane sees a cleaner feed and fouls more slowly. In the textile pilot this delivered 93% COD removal and 99% TSS removal at HRT 1 day (per S1); in the S3 work the MBBR effluent averaged 37 mg/L COD from a 528 mg/L feed, and the subsequent MBR permeate ran 12 mg/L COD (per S3). Leiknes & Ødegaard reported that MBMBR filtration flux was substantially better than conventional MBR because of lower cake resistance (per S3); the PMC K1-carrier study quantified the same effect — time-to-total-fouling moved from day 31 in the control to day 43 in the MBBR-MBR K1 unit and beyond 40 days in the 13X-H unit (per S5).
This configuration is the most likely to meet cooling-tower and gland-water turbidity targets without a downstream RO, while still reducing the membrane CIP interval compared with a standalone MBR. The operator story is medium burden — the MBBR front end lowers SMP and cake resistance, so CIP frequency drops, but operators still run a membrane skid, so hours-per-week sit between the standalone MBBR and the standalone MBR. For a 2,000–10,000 m3/d mine-site reuse loop this is the 2026 default specification; an integrated MBR system for mining process water paired with a pre-engineered MBBR tank is the procurement shortcut.
Decision Framework: When to Choose MBR, MBBR, or MBBR-MBR
Three questions, one answer each. Run them in a meeting and the verdict is usually obvious.
| If your plant needs... | Specify... | Why |
|---|---|---|
| Discharge to a river or sewer, no reuse roadmap, lowest CAPEX and operator headcount | MBBR (standalone) | 68.4% lower CAPEX than MBR; no membrane CIP; 5–10 operator-hr/week (per S1) |
| Reuse turbidity <1 NTU for cooling-tower or mill-service water, operators trained on membrane CIP | MBR (standalone) with strong pre-treatment | pH adjustment + DAF or lamella clarifier drops metals and hardness to membrane-safe levels; 99.4% TSS removal (per S1) |
| Reuse quality, lower fouling risk, medium operator burden acceptable | MBBR-MBR hybrid (MBMBR) | Fouling delay day 31 → day 43 with K1 carriers (per S5); 93% COD, 99% TSS at HRT 1 day (per S1) |
| Reuse quality but no membrane CIP capability on site | MBBR + UF polishing | MBBR handles organics; UF polishing for MBBR effluent reuse drops turbidity to <1 NTU without the operator CIP burden of an MBR |
For a deeper parameter dive see the general MBR vs MBBR comparison for industrial plants; for metal-finishing specifically, the MBR engineering specs for metal-finishing wastewater piece covers the CIP math in detail. The MBR vs MBBR reuse turbidity and operator burden analysis for pharma shows the same hybrid logic in a different influent envelope.
Frequently Asked Questions
What is the CAPEX saving of MBBR over MBR for a metals-plant-scale system?
The textile-pilot economic study found MBBR saved 68.4% of CAPEX versus MBR at industrial scale, with OPEX equal to MBR (per S1). On
Frequently Asked Questions
Which is better for mining process water reuse, MBR or MBBR?
MBR (Membrane Bioreactor) is generally superior for reuse applications requiring high-quality permeate, as it provides a physical barrier that consistently achieves turbidity levels below 0.2 NTU and effectively rejects suspended solids and bacteria. MBBR (Moving Bed Biofilm Reactor) is better suited for high-load carbonaceous BOD removal or nitrification in space-constrained environments but requires downstream tertiary filtration to approach the reuse standards typically demanded by modern mining operations.
Can MBBR effluent meet a less than 1 NTU reuse turbidity limit?
An MBBR process alone cannot achieve a consistent effluent turbidity of less than 1 NTU, as it is a suspended-growth or biofilm process that relies on downstream secondary clarifiers or dissolved air flotation units which typically produce effluent in the 5 to 20 NTU range. To meet a sub-1 NTU limit, an MBBR system must be followed by tertiary treatment technologies such as multi-media filtration or ultrafiltration.
How does heavy metal toxicity affect MBR and MBBR performance?
Heavy metals such as copper, zinc, and lead can inhibit microbial activity in both systems, but MBRs are often more resilient because the membrane retains biomass, allowing for higher sludge ages (SRTs) and the potential development of metal-tolerant specialized bacteria. MBBRs are susceptible to biofilm sloughing and loss of nitrification capacity when metal concentrations exceed inhibitory thresholds, often requiring upstream chemical precipitation or ion exchange to protect the biological population.
What is the typical membrane cleaning interval for an MBR treating metal-laden wastewater?
In mining applications, membrane cleaning intervals for MBRs are highly variable based on influent chemistry but typically range from 3 to 6 months for Maintenance Cleans (MC) and 6 to 12 months for Clean-in-Place (CIP) procedures. Frequent fouling from metal-hydroxide scaling or inorganic precipitates often necessitates more aggressive chemical conditioning or optimized flux rates to prevent irreversible pore blocking compared to municipal MBR applications.
Is the MBBR-MBR hybrid worth the extra cost for a copper or zinc plant?
The hybrid configuration is highly recommended for copper and zinc facilities because it utilizes the MBBR stage to reduce the organic and metal-loading shock to the membrane, significantly extending membrane lifespan and reducing fouling rates. While capital expenditure is 20-30% higher, the reduction in chemical cleaning frequency and the increased robustness of the system against process fluctuations often result in a lower total cost of ownership over a 10-year operational lifecycle.