Why Industrial Fluoride Is a Treatment Problem
Fluoride is removed from industrial wastewater using four principal technologies: chemical precipitation (typically calcium, forming CaF₂) for high-strength streams above 100 mg/L; adsorption on activated alumina or bone char for mid-range polishing; anion exchange resins for low-F⁻ polishing; and reverse osmosis or nanofiltration for final polishing to below 10 mg/L. Industrial F⁻ becomes toxic above 10 mg/L — the discharge limit in jurisdictions such as China — so method selection is driven by influent concentration, co-ions, and required effluent quality, not by cost alone.
Industrial fluoride is generated at concentrations that municipal plants never see. Iron and steel pickling, copper and zinc smelting, lithium-ion battery electrolyte lines, cement kilns, glass etching, semiconductor wet-etch (HF and NH₄F baths), and phosphate fertilizer operations all release F⁻ at 20–several thousand mg/L into the wastewater stream (per ScienceDirect 2021 review). Once F⁻ exceeds 10 mg/L it becomes severely toxic to humans, plants, and aquatic life (Bhaumik et al., 2011; Singh et al., 2017), while the safe range for drinking water is 0.4–0.6 mg/L (Kumar et al., 2019; Vinati et al., 2015). That is the regulatory gap a process engineer has to close.
The chemistry is unforgiving. Fluoride is a small monovalent anion with high hydration energy, and it is not biodegradable. Primary mechanical treatment and secondary activated-sludge biology do not remove it in any meaningful way — a 2020 study across seven sewage plants found primary treatment "did not significantly remove" trace anions and organics, with only tertiary oxidation/GAC capable of polishing the residuals (per McGraw-Hill 2020). The U.S. EPA sets a 4 mg/L MCL for drinking water and a 0.7–1.2 mg/L public-health range, but industrial discharge permits typically run 10–50 mg/L depending on jurisdiction and receiving stream. That is the correct design target for the process engineer, not the 4 mg/L drinking-water number.
The Four Industrial Fluoride Removal Methods Compared
Precipitation, adsorption, ion exchange, and membrane separation cover virtually every industrial defluoridation problem. Each has a distinct operating envelope; no single technology wins across all influent concentrations and flow rates.
Method 1 — Chemical precipitation. Lime, Ca(OH)₂, or CaCl₂ dosing forms CaF₂ (Ksp ≈ 3.9 × 10⁻¹¹). A two-column limestone reactor demonstrated reduction of feed F⁻ to below 4 mg/L by combining calcite dissolution with fluorite precipitation in the first column and re-precipitating dissolved calcite in the second (Environmental Science & Technology, 1999). This is the workhorse for high-strength streams above 100 mg/L.
Method 2 — Adsorption. Activated alumina, bone char, modified biomass, and metal-organic-framework adsorbents all show useful F⁻ capacity. Capacity is strongly pH-sensitive — the optimal window is pH 5–6 — and contact-time dependent, so surface-loading rates and EBCT must be sized deliberately (per ScienceDirect 2021 review).
Method 3 — Anion exchange. Strong-base resins exchange Cl⁻ or OH⁻ for F⁻ and are effective as a low-F polishing step. They are fouled by competing anions and require 5–10% NaCl regeneration at 2–4 bed volumes per cycle (per waterdefense.org).
Method 4 — Membrane (RO and NF). Reverse osmosis removes 90–99% of fluoride (per waterdefense.org). Industrial systems operate at 75–85% recovery, produce 15–25% reject by volume, and consume 3–6 kWh/m³. Nanofiltration achieves 80–95% rejection at lower pressure and is a useful intermediate step for mid-range feeds.
Advanced oxidation (ozonation, GAC) addresses trace organics, not F⁻ — readers sometimes conflate the two from pharmaceutical-removal briefings, but neither O₃ nor activated carbon meaningfully touches the fluoride ion.
| Method | Best influent range (mg/L F⁻) | Typical effluent (mg/L F⁻) | Key reagent / energy | Main waste stream |
|---|---|---|---|---|
| Chemical precipitation (lime/CaCl₂) | 50 – >1,000 | 10 – 20 | 2–4× stoichiometric Ca²⁺ dose | CaF₂ sludge, 1.5–2.5 kg DS/m³ |
| Adsorption (activated alumina) | 5 – 50 | 1 – 2 | pH 5–6 control; 1–5 mg F⁻/g media | Spent media, 6–12 month life |
| Anion exchange (strong-base resin) | < 20 | < 1 | 5–10% NaCl regen, 2–4 BV/cycle | Brine regenerant, ~5% of throughput |
| RO / nanofiltration | < 100 (after pretreatment) | < 2 | 3–6 kWh/m³, 15–30 bar | 15–25% reject, recycled upstream |
Precipitation and Coagulation: The Workhorse for High-Fluoride Streams
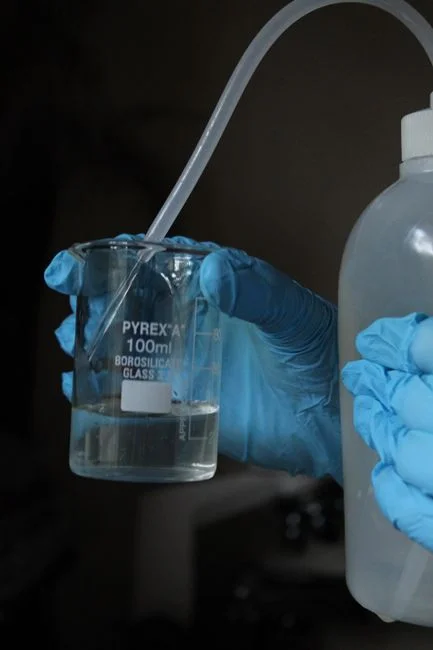
Calcium precipitation is the default first stage for any influent above ~50 mg/L. The reaction is straightforward: Ca²⁺ + 2F⁻ → CaF₂(s). Industrial dosing runs 2–4× the stoichiometric requirement to overcome competing reactions with sulfate, phosphate, and carbonate and to push residual F⁻ below 15–20 mg/L. A PLC-controlled chemical dosing system for lime and CaCl₂ is standard equipment, with pH held between 6 and 8 — below 6 the CaF₂ re-dissolves, above 9 Ca(OH)₂ dominates and sludge volume rises sharply.
Co-precipitation with aluminum-based coagulants (alum or PAC) polishes another 5–15 mg/L by adsorbing residual F⁻ onto amorphous Al(OH)₃ floc, but it adds 1.5–2.5 kg of dry chemical sludge per cubic metre treated (per ScienceDirect 2021 review). The resulting CaF₂/Al(OH)₃ cake is dense and crystalline, and a plate-and-frame filter press for CaF₂ sludge typically dewateres it to 60–70% dry solids for landfill disposal — well above the 25–35% DS achievable in a gravity thickener.
Single-stage precipitation rarely hits a 10 mg/L discharge limit on its own; expect 15–20 mg/L residual and plan a polishing step. The exception is when residence time exceeds 4 hours and the molar Ca:F ratio is held above 2.5, where some facilities report single-stage residuals in the 8–12 mg/L range.
Adsorption and Ion Exchange for Polishing
When precipitation bottoms out at 15–20 mg/L, a polishing stage is needed to meet a 10 mg/L industrial limit. Activated alumina is the most common adsorbent, with a working capacity of 1–5 mg F⁻ per gram of media at pH 5.5 and breakthrough typically at 1–2 mg/L effluent. Bone char delivers higher capacity but introduces organic loading, biological growth in warm streams, and is restricted in vegan-certified supply chains.
Anion exchange resins — Type I strong-base polystyrene — can drop effluent below 1 mg/L from feeds under 10 mg/L, which makes them the right choice for low-F polishing. Regeneration uses 5–10% NaCl at 2–4 bed volumes per cycle (per waterdefense.org); expect to dispose of roughly 5% of throughput as a fluoride-laden brine.
Both methods are sensitive to competing anions. Sulfate, chloride, and bicarbonate all compete for exchange sites, so pre-softening or a multi-bed train (cation exchange → adsorber) is common when TDS exceeds 500 mg/L. Plan for media replacement on activated alumina every 6–12 months depending on throughput and influent loading.
Membrane Polishing: RO and Nanofiltration to Reuse Quality

Reverse osmosis delivers the highest-purity effluent and the highest capital cost. RO removes 90–99% of fluoride (per waterdefense.org) and is the only single technology that produces permeate suitable for process-water reuse. Nanofiltration achieves 80–95% removal at lower pressure (10–25 bar versus 15–30 bar for RO) and is a useful intermediate when discharge limits are 10–20 mg/L rather than reuse-grade.
Industrial recovery is held at 75–85%. Pushing recovery above 85% risks CaF₂ precipitation on the membrane surface once the reject-side concentration exceeds the solubility product, and the resulting scaling is irreversible without aggressive CIP. The reject stream — 15–25% of feed by volume — is normally recirculated to the precipitation influent, which closes the loop and protects the discharge limit on the reject itself.
Anti-scalant dosing and periodic clean-in-place are mandatory when feed F⁻ exceeds 50 mg/L. A properly designed industrial RO system for fluoride polishing should include a CIP skid, an anti-scalant injection point, and a high-pressure recirculation pump sized for the design recovery. Pretreatment by multimedia filtration and, in high-TDS streams, softening is non-negotiable; for more on the engineering mechanics, see the industrial RO engineering mechanics guide.
Technology Selection Matrix: Match Influent to Process
Influents above 100 mg/L require precipitation first; single-stage RO on a high-F feed is uneconomic and risks scaling within hours. The first stage is calcium precipitation in a lamella clarifier, followed by either RO or ion exchange for polishing. 10–100 mg/L feeds can go either to direct precipitation or to adsorption on activated alumina, with RO justified only when water reuse is a parallel goal and the permeate value offsets the operating cost. Below 10 mg/L, ion exchange or single-pass RO is the right choice — precipitation is uneconomic and produces more sludge than F⁻ removed.
Co-contaminants shift the decision. Heavy metals (chromium, lead, nickel) argue for precipitation co-removal, which can hit two compliance parameters in one stage — see the chromium removal process guide and the lead removal process guide for paired designs. High TDS (above 2,000 mg/L) and high sulfate argue for RO first, with precipitation as the reject-handling step rather than the head-end process.
| Influent F⁻ (mg/L) | Primary technology | Polishing step | Discharge target | Sludge / reject handling |
|---|---|---|---|---|
| > 100 | CaCl₂/lime precipitation + lamella | RO or ion exchange | < 10 mg/L | CaF₂ sludge to filter press; RO reject recycled |
| 10 – 100 | Precipitation OR direct adsorption | Activated alumina OR RO | < 10 mg/L | Sludge to filter press; RO reject recycled |
| < 10 | Ion exchange OR single-pass RO | None required | < 2 mg/L for reuse | Brine regenerant or RO reject disposal |
| Any F⁻ + heavy metals | Co-precipitation (pH 8–9) | RO if reuse needed | Multi-parameter | Mixed-metal/F sludge to secure landfill |
Process Train Example: Glass-Etching Facility, 50 mg/L F⁻ Influent
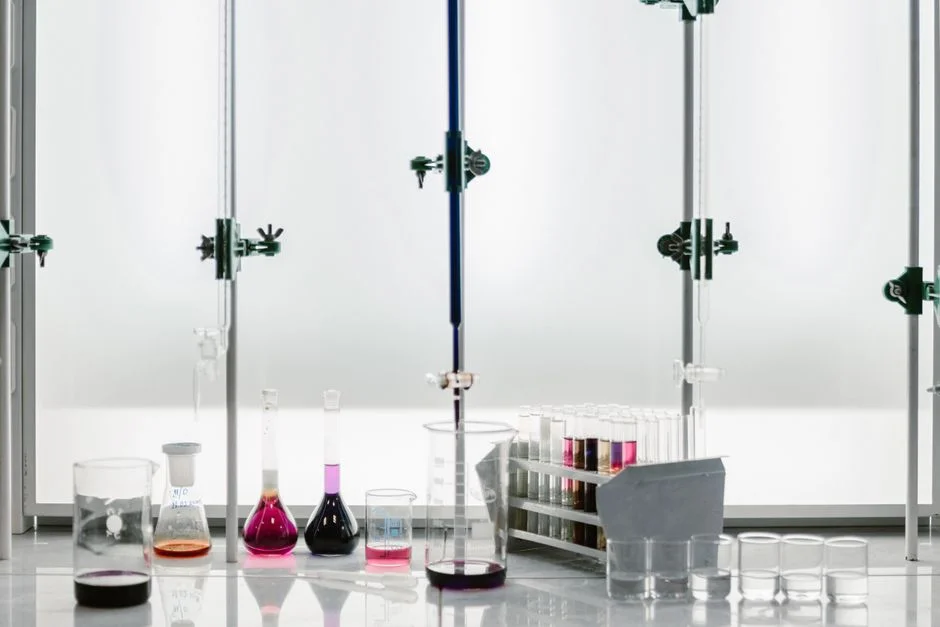
A typical architectural-glass etching line generates rinse water at 30–80 mg/L F⁻ with 200–400 mg/L suspended solids and trace aluminum from the etch bath. The four-stage process train below meets a 10 mg/L industrial discharge limit and produces permeate clean enough for rinse-water reuse.
- pH adjustment and precipitation. Lime dosing to pH 7.0–7.5 followed by CaCl₂ addition in a high-rate lamella clarifier for CaF₂ sludge. Hydraulic residence time 2–3 hours; F⁻ drops to 12–18 mg/L and TSS to under 30 mg/L.
- Multimedia filtration. A multi-media filter for RO pretreatment (anthracite/sand/garnet) polishes carryover solids to under 5 mg/L TSS, protecting the RO membranes from fouling.
- Two-pass RO. A brackish-water industrial RO system for fluoride polishing operating at 78% recovery, 18 bar, delivers permeate below 2 mg/L F⁻ suitable for rinse reuse; concentrate is recycled to the clarifier influent.
- Sludge dewatering. Clarifier underflow at 2–4% DS is pumped to a plate-and-frame filter press for CaF₂ sludge, producing a 65% DS cake for non-hazardous landfill disposal. Filtrate returns to the clarifier.
Expected operating envelope: 3.5–4.5 kWh/m³, 2.0–2.5 kg CaCl₂ per m³ feed, and 1.8–2.2 kg dry sludge per m³ feed. Footprint for a 50 m³/h line is approximately 120 m² for the precipitation/clarification stage and 80 m² for the RO and filtration stage combined.
Frequently Asked Questions
What fluoride discharge limit applies to industrial wastewater in the U.S. and China?
Industrial F⁻ discharge limits in the U.S. are permit-specific, typically 10–50 mg/L depending on receiving stream and sector, with the EPA drinking-water MCL of 4 mg/L not directly applicable to industrial effluent. China sets 10 mg/L as the national industrial emission standard, the same threshold at which F⁻ becomes toxic to humans and aquatic life (Bhaumik et al., 2011; Singh et al., 2017).
How is RO reject containing concentrated fluoride handled?
RO reject — typically 15–25% of feed volume at 4–6× the influent F⁻ concentration — is recycled to the upstream precipitation stage in a closed-loop design. This both protects discharge limits and reduces fresh CaCl₂ demand, since the calcium dose already present in the clarifier will precipitate the recycled fluoride.
What is the typical operating cost for an industrial defluoridation system?
For a 50 m³/h feed at 50 mg/L F⁻, total operating cost runs $0.40–0.70 per m³ treated, dominated by CaCl₂ (40–50%), energy for RO and sludge pumping (25–30%), and resin/media replacement (10–15%). Footprint is approximately 200 m² for a complete precipitation + RO train at this flow rate.
How is CaF₂ sludge dewatered and disposed?
Clarifier underflow at 2–4% dry solids is pumped to a plate-and-frame filter press, which produces a 60–70% DS cake suitable for non-hazardous landfill disposal in most jurisdictions. Filtrate is returned to the clarifier; cake volume is roughly 1.5–2.5 kg DS per m³ of wastewater treated.