This oxidation ditch commissioning engineering guide holds channel velocity at 0.25–0.35 m/s in clean water, seeds to 2,000–3,000 mg/L MLSS, and locks SRT at 20–24 days through the first 28 days.
What an Oxidation Ditch Is — and Why Commissioning Differs From Other Activated Sludge
Oxidation ditch installation and commissioning is the sequenced handover of a racetrack activated-sludge basin from civil completion to stable biological operation. The 2026 field standard sets mixed-liquor velocity at 0.25–0.35 m/s, MLSS at 1,500–5,000 mg/L, RAS at 75–150%, and an SRT of 12–24 days when nitrification is required (per the EPA Wastewater Technology Fact Sheet on Oxidation Ditches, EPA 832-F-00-013). The ditch itself is a modified activated-sludge process run in a ring, oval, or horseshoe basin where aerators drive the loop while entraining oxygen.
SSWM's sector reference describes the hardware plainly: oxidation ditches are "large round or oval ditches (channel reactors) used for the aerobic treatment of wastewater," with aerators that mix and move the prescreened content around the ditch, and the same source rates them "resilient to shock loads as it often occurs in smaller communities." Aerator types include brush rotors, disc aerators, draft-tube units, or fine-bubble diffusers (EPA 832-F-00-013). The technology dates to the first full-scale unit in Voorschoten, Holland, in 1954, and the U.S. installed base exceeds 9,200 municipal plants (WEF, 1998, as cited in EPA 832-F-00-013).
Three design attributes separate ditch commissioning from conventional activated-sludge startup. First, hydraulic retention time is long — 6 to 30 hours in most municipal plants — which is exactly what lets the basin absorb shock loads but also what prevents anyone from rushing the biology. Second, the loop is a complete-mix reactor by default, and any move toward plug-flow behavior forces a switch to diffused air and stops being an oxidation ditch at all (EPA 832-F-00-013). Third, the long SRT required for nitrification is selected against minimum mixed-liquor temperature, not against influent BOD, so the commissioning team must lock the SRT target before seeding and protect it through the first 90 days.
Oxidation Ditch Commissioning Engineering Guide: Design Parameters You Must Hold
The consolidated numeric envelope below is what the commissioning team holds before water enters the basin. The values are drawn from the EPA factsheet's design section (EPA 832-F-00-013), with citations to Metcalf & Eddy (1991) and Baker Process (1999) as the underlying engineering references.
| Parameter | Design range | Commissioning implication |
|---|---|---|
| HRT (municipal) | 6–30 h | Sets the minimum time the biology has to stabilize; do not force design flow before day 14. |
| SRT (general) | 4 to 48+ days | Selected against minimum mixed-liquor temperature, not influent BOD. |
| SRT for nitrification | 12–24 days | Hold at 20–24 days during the first 28 days to favor nitrifier colonization. |
| MLSS | 1,500–5,000 mg/L | Target 1,500–2,500 mg/L during ramp; do not chase 5,000 mg/L until steady state. |
| RAS ratio | 75–150% | Operator-led tuning, not a redesign lever, per the 2022 EPA Optimizing Nutrient Removal webinar (S5). |
| Channel velocity | 0.25–0.35 m/s (0.8–1.15 ft/s) | Hard gate before seeding. Below 0.25 m/s, solids drop out and bulking follows. |
| BOD loading | ~240,000 mg/1000 L/day (15 lb/1000 ft³/day) | Common design value; the rate is not used to set the nitrification decision. |
| OTE (brush/disc) | 2.5–3.5 lb O₂/Hp-hr | Use to reconcile aerator runtime against measured oxygen demand. |
SRT is the master variable. It is chosen as a function of the nitrification requirement and the minimum mixed-liquor temperature, which means a basin starting up in winter at 10°C will need a longer SRT than the same basin starting at 22°C in summer. General references frame the typical operating point rather than the contract band: Wikipedia's oxidation ditch entry lists "a hydraulic retention time of 24 – 48 hours, and a sludge age of 12 – 20 days" for typical installations. State the governing reference in the commissioning spec, because the EPA design band and the general-reference band do not overlap at the top end.
If the project is actually a Modified Ludzack-Ettinger (MLE) configuration — an anoxic tank upstream of the aerobic loop with mixed-liquor recirculation of 3Q–4Q — or a cycled anoxic/aerobic variant (EPA 832-F-00-013), confirm the SRT target against that configuration's denitrification requirement before the seeding volume is calculated.
Oxidation Ditch Installation Checklist: Civil, Mechanical, and Hydraulic Readiness

Most ditch startups that derail in the first 30 days were already lost at the civil-to-mechanical handover. Walk the following gates before introducing a single gallon of influent. Construction typically uses reinforced concrete, with gunite, butyl rubber, or clay as accepted alternates; impermeability is the acceptance criterion, not the surface material (EPA 832-F-00-013).
| Discipline | Acceptance gate | Numeric anchor |
|---|---|---|
| Civil | Channel dimensions match drawings, no debris or curing compounds in basin | ±25 mm tolerance on freeboard; visual + photos |
| Mechanical | Brush rotors / disc / draft-tube units aligned, gearboxes, bearings, VFD setpoints verified | Vibration < 4.5 mm/s RMS at bearing housing |
| Diffusers (if vertical) | Grid balanced, no leaks, all EPDM membranes seated | Air-flow variance < ±10% per header |
| Instrumentation | DO probes at ≥3 points (entrainment, mid-channel, return end), MLSS, RAS flow, temperature | DO probe air-cal within 0.1 mg/L |
| Hydraulic | Inlet works, bar screens, grit removal, secondary clarifier operational; leak test passed | Leak rate < 0.1% volume/24 h |
| Safety | LOTO on all rotating equipment, confined-space permits issued, OSHA aerator guarding | Per 29 CFR 1910.146 and 1910.219 |
For an upstream bar screen that can actually handle the design peak flow without blinding, the rotary mechanical bar screen used in municipal oxidation ditch headworks is the typical specification point; clean it before the basin fill so commissioning rags and concrete fines do not migrate into the loop. Sign off each row with a date and a name. A checklist with a measurable pass criterion on every line is what separates a defensible handover from a "we'll fix it in startup" outcome.
Oxidation Ditch Aerator Velocity Verification in Clean Water
Clean-water velocity verification is the single highest-impact test in the entire commissioning sequence. If the ditch does not circulate at the design velocity with clean water, no amount of seed sludge will save the biology. Fill the basin to design level, start aerators sequentially, and measure channel velocity with a flow meter or a float-trace method. The acceptance window is 0.25–0.35 m/s; below 0.25 m/s, mixed-liquor suspended solids will not stay in suspension and the result is dead zones followed by filamentous bulking within the first 14 days (EPA 832-F-00-013, citing Metcalf & Eddy, 1991).
Regulatory design practice confirms the same number from the compliance side. Virginia's sewage collection and treatment regulation (9VAC25-790-700) requires "a minimum velocity throughout the oxidation ditch cross-section of 1.0 fps at maximum design depth and solids concentration" — 1.0 fps is roughly 0.30 m/s, the midpoint of the acceptance band. The same regulation caps the outer channel at "a loading of 15 pounds per 1,000 cubic feet of volume or less" and defines extended aeration as "an aeration basin with a detention volume of 18 hours or more at the design flow rate," both consistent with the design table above.
If velocity is below range, fix the hydraulics before seeding: adjust rotor blade pitch, raise aerator submergence, or correct VFD setpoints, then re-test until the reading sits inside the band. If the design uses fine-bubble diffusers in a vertical configuration, perform air-flow balancing across the grid before seeding — a variance greater than ±10% per header will create oxygen-starved pockets that look like biological problems but are actually mechanical. Once velocity is verified, map the dissolved oxygen profile at a minimum of four points around the loop: expect a peak near the aerator and a gradual decline as biomass uptakes oxygen along the channel. The map tells you whether oxygen demand is being met and where the dead zones are hiding.
Oxidation Ditch Seeding and Acclimation Guide
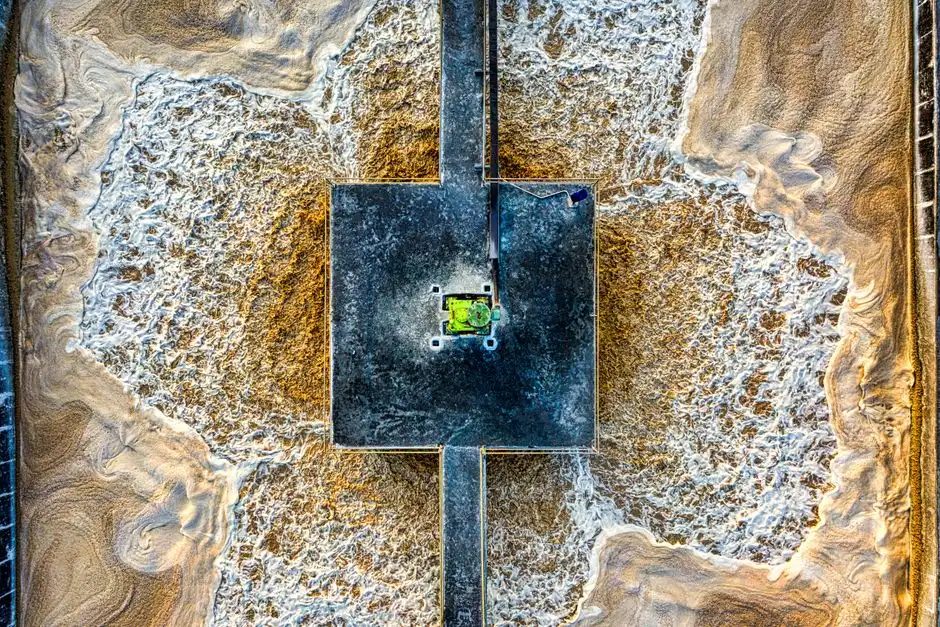
Seeding starts only after the loop is proven in clean water, and the next 28 days determine whether the basin produces effluent or produces foam. Preferred seed is return activated sludge from a neighboring plant, targeted to bring the basin to 2,000–3,000 mg/L MLSS at fill; commercial bioaugmentation or seeded synthetic wastewater are fallbacks if no donor plant is available. Document volume, source, and seed MLSS so the SRT calculation has an honest starting point.
Oxidation Ditch MLSS Startup Procedure: Days 1–28
Begin influent feed at 25–50% of design flow for the first 7 days, then ramp to design flow over 14–21 days as MLSS climbs into the 1,500–2,500 mg/L window. Hold SRT at 20–24 days initially — well above the 12-day minimum for nitrification — to favor nitrifier colonization. Expect measurable nitrification by day 21–28 when mixed-liquor temperature is above 15°C; below 12°C, push the SRT target to 30+ days or accept delayed nitrification onset.
Target bulk mixed-liquor DO at 1.5–2.0 mg/L with continuous logging; readings persistently below 1.0 mg/L trigger filamentous growth risk and the foam events that follow. The 2022 EPA Optimizing Nutrient Removal webinar (S5) makes the same point from the operator side: most day-one gains at the Chinook MT, Great Bend KS, and Cookeville TN facilities came from operator-led tuning of DO setpoints and RAS, not from redesign. Foam control during this window is a real operational headache; the How to Solve Foam Control in Wastewater Treatment (2026 Guide) covers antifoam selection, RAS chlorination, and selector zoning in detail.
Oxidation Ditch Performance Acceptance Testing and Operator Handover
Performance acceptance testing needs "commissioned" defined with numbers before the test starts. Run a 7-day composite sampling campaign at design flow and compare BOD, TSS, and ammonia-N removal against the EPA-validated reference plants: Casa Grande AZ at 96% BOD, 97% TSS, 94% TN, and Edgartown MA at 99% BOD, 97% TSS, 90% TN (EPA 832-F-00-013, citing 1997–1999 monthly averages). Oxygen consumption should reconcile to 1.1–1.5 kg O₂ per kg BOD removed plus 4.57 kg O₂ per kg TKN oxidized against measured aerator runtime and OTE in the 2.5–3.5 lb O₂/Hp-hr band (EPA 832-F-00-013, citing EPA 1991 and Baker Process 1999). Sludge production should land in 0.2–0.85 kg TSS per kg BOD applied, with 0.65 kg/kg as the typical value; this confirms waste-sludge pumping capacity is correctly sized for steady state (EPA 832-F-00-013, citing Sherwood Logan and Associates, 1999).
| Acceptance metric | Target | Reference |
|---|---|---|
| BOD removal | ≥ 90% (≥ 96% to match Casa Grande) | EPA 832-F-00-013 |
| TSS removal | ≥ 97% | EPA 832-F-00-013 (Casa Grande, Edgartown) |
| Total N removal | ≥ 90% (94% Casa Grande; 90% Edgartown) | EPA 832-F-00-013 |
| O₂ per kg BOD removed | 1.1–1.5 kg | EPA 1991 / Baker Process 1999 |
| Observed yield | 0.2–0.85 kg TSS/kg BOD (typ. 0.65) | Sherwood Logan & Associates 1999 |
The handover package should include as-built drawings, calibrated instrument certificates, the clean-water velocity test report, the 7-day composite data, the 28-day biological log, and a written 90-day optimization plan tied to EPA nutrient-removal guidance. The operator inherits a tuning roadmap, not just a working basin. For plants moving toward tighter effluent limits, an MBR membrane bioreactor system downstream of the ditch is the typical upgrade path, and a plate and frame filter press handles the corresponding increase in wasted sludge volume.
For CASS-style retrofits that share the same extended-aeration biology, the CASS Process Design Parameters: 2026 Engineering Reference is a useful complement, and the MBR Common Problems and Solutions: 2026 Engineering Troubleshooting Guide covers the membrane side if the project includes an MBR polish.
Who This Guide Fits, and the Next Step
This oxidation ditch commissioning engineering guide fits EPC commissioning teams, plant operators inheriting a new ditch, and consultants writing acceptance criteria. Design values themselves — basin sizing, loading, and configuration selection — belong to the companion Oxidation Ditch Design Parameters: 2026 Engineering Reference, while an upgrade of the capacity of the oxidation ditch at an existing site is a separate project path covered on its own page. Where disinfection or reuse is in the scope, pair the handover with an Ozone Generator & Water Tank Sterilization System sized to the effluent loop.
To turn this into a project-specific plan, send basin drawings, influent characteristics, and the contract effluent limits through the request-a-quote channel for a commissioning sequence and acceptance test plan built around your numbers.
Frequently Asked Questions
What is the typical hydraulic retention time for an oxidation ditch?
HRT for municipal oxidation ditches ranges from 6 to 30 hours, with most designs landing between 18 and 24 hours (EPA 832-F-00-013). General references put typical installations at 24–48 hours with a sludge age of 12–20 days. Long HRT is what gives the basin its shock-load tolerance and is the reason biological commissioning cannot be rushed.
What is the minimum SRT needed for nitrification during commissioning?
The minimum SRT for nitrification is 12 days at warm mixed-liquor temperatures, but the EPA factsheet's typical design band is 12–24 days (EPA 832-F-00-013). During the first 28 days, hold SRT at 20–24 days to favor nitrifier colonization, and extend to 30+ days if the basin starts up below 12°C.
How much seed sludge is needed to start an oxidation ditch?
Seed with enough return activated sludge — or equivalent bioaugmentation product — to reach 1,500–2,000 mg/L MLSS at basin fill, with 2,000–3,000 mg/L as the preferred starting point when donor RAS is available. Document seed volume, source plant, and seed MLSS so the SRT arithmetic has a defensible origin.
When will the basin first show nitrification?
Expect measurable nitrification by day 21–28 when mixed-liquor temperature is above 15°C and SRT is held at 20–24 days. Below 12°C, nitrification onset shifts later and the SRT target must be raised to compensate (EPA 832-F-00-013).
What is the most common startup failure for an oxidation ditch?
Insufficient mixed-liquor velocity. The hard gate is 0.25–0.35 m/s channel velocity in clean water before seeding; below 0.25 m/s, MLSS drops out of suspension, dead zones form, and filamentous bulking follows within the first 14 days (EPA 832-F-00-013). Virginia's 9VAC25-790-700 design rule of 1.0 fps at maximum depth and solids concentration points at the same threshold.
How long does full commissioning take from civil handover?
Plan on the clean-water tests plus a 28-day biological ramp, followed by a 7-day composite acceptance campaign at design flow. Cold-weather startups stretch the biology leg, because nitrification below 12°C pushes the SRT target to 30+ days. Budget the schedule against mixed-liquor temperature, not against the civil completion date.