What Makes Dairy Wastewater Maintenance Different in 2026
Dairy wastewater plant maintenance in 2026 is a staged, KPI-driven program covering screening, equalization, DAF, biological or MBR treatment, disinfection, and sludge handling. Because dairy streams carry 0.2–2.88 g/L FOG, 0.8–77 g/L whey COD, and modern QAC-based CIP chemicals, every stage needs a defined inspection interval, alarm threshold, and cleaning protocol — typically daily screen checks, weekly DAF inspection, monthly membrane integrity testing, and quarterly full-system audits.
Dairy plants run warm. Annual effluent temperatures sit at 17–25 °C versus 10–20 °C for municipal sewage, and that 5–10 °C lift accelerates biological fouling, sulfide generation, and odor (per PMC5434364, 2017). A 100,000–400,000 gal/day plant typically loses 0.5–2.5% of processed milk to drain, climbing to 3–4% in poorly controlled lines, and that "cow water" condensate makes up 20–30% of total wastewater volume yet is reusable for floor wash, primary wash, and cooling (per Dairy Processing, 2025-07). Chloride peaks of 0.8–1 g/L in cheese lines promote pitting on 304 stainless — a hidden maintenance cost that equalization-basin mixers, pH probes, and DAF saturator piping all share.
The 2026 inflection point is chemistry. QAC and peracetic-acid use in CIP has risen sharply to meet FDA sanitation expectations, and those cationic surfactants now flip DAF floc charge and inhibit nitrification — the most under-reported source of unexplained KPI drift in dairy plants (per Dairy Processing, 2025-07). A defensible 2026 maintenance program must address four failure modes simultaneously: FOG accumulation, chloride-driven corrosion, QAC toxicity, and biological bulking. Treat any one in isolation and the next stage downstream pays the price.
Headworks and Screening: Daily Checks That Prevent Cascade Failures
Screening is the cheapest insurance on the plant. A 4–6 h rake cycle on a rotary mechanical bar screen removes rags, film, and curd chunks before they blind DAF nozzles or tear MBR fibers — failures that cost ten times more to fix than the screen itself. In high-fat lines running 0.2–0.4 g/L FOG (up to 2.88 g/L in butter plants per PMC5434364, 2017), expect to hose down the bar deck every shift.
A 90-second daily walk-around should confirm: rake torque under nameplate, no rag carryover past the discharge chute, downstream rag count at zero per shift, and an upstream-to-downstream TSS delta under 15% across the screen. A sudden downstream pH drop paired with foam is the field signature of QAC breakthrough from a CIP acid flush — divert upstream flow to a dedicated quench tank and call the sanitation team before the DAF collapses. A GX series rotary mechanical bar screen sized for 0.5–1.5 m/s approach velocity handles the rag loads typical of 100,000–400,000 gal/day dairy service.
| Check | Cadence | Target / Threshold | Alarm |
|---|---|---|---|
| Rake torque vs. nameplate | Daily | <80% rated | >90% sustained 15 min |
| TSS delta across screen | Daily grab, weekly composite | <15% increase downstream | >20% — clean bars, check slot size |
| Downstream rag count | Each shift | 0 rags per 1,000 gal | ≥3 rags — schedule hosing |
| Brush / squeegee wear | Weekly | Bristles >50% height | Replace before next quarter audit |
| Bearing temperature & overload | Quarterly | <70 °C, no fault trips | >75 °C or 2 trips/quarter |
| pH + foam downstream | Continuous | pH 6.5–8.5, no foam blanket | pH swing >1 unit + foam → QAC flag |
Equalization Basins: Stabilizing 24-Hour Load Spikes
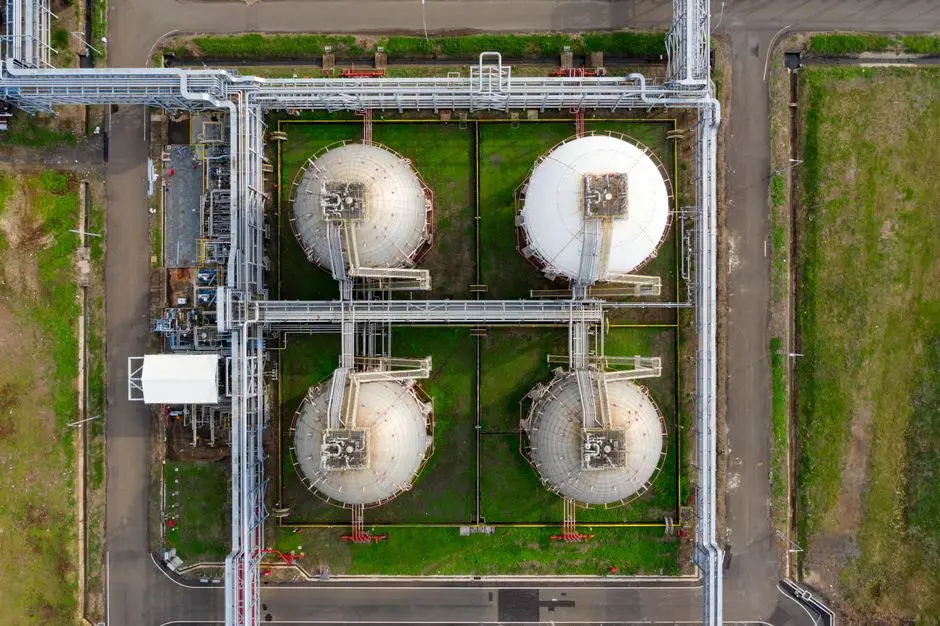
Equalization is the highest-leverage maintenance item in a dairy train because it determines what every downstream stage sees. A basin sized at 25–50% of total daily flow, providing 6–12 h of HRT, flattens the 24-hour production cycle and absorbs the 5–10× swings that butter and cheese CIP routines impose (per PMC5434364, 2017). On a 200,000 gal/day plant, that means 50,000–100,000 gal of buffer — operators should verify the working volume has not been lost to dead zones or sediment.
Maintenance focus is mechanical, not glamorous. Submersible mixers need seal and oil inspection every 6 months; pH and temperature probes calibrated quarterly against buffer standards; surface scum removed weekly with a skimmer or floating decanter because the FOG layer is where QAC partitions and where odor starts. Hold basin temperature under 30 °C to suppress thermophilic souring — at 22–25 °C summer influent plus biological heat, this is a real ceiling (per PMC5434364, 2017). For cheese lines with 0.8–1 g/L peak Cl⁻, spec 316L wetted parts on mixers, level sensors, and pH probes; 304 stainless pits in months under those conditions.
| Parameter | Target | Maintenance Action | Cadence |
|---|---|---|---|
| Basin HRT | 6–12 h | Verify working volume, no dead zones | Quarterly |
| pH swing across 24 h | <1.5 units, range 6.5–8.5 | Probe calibration, mixer runtime audit | Quarterly probe / daily log |
| Temperature | <30 °C | Check influent temperature, surface scum | Continuous |
| Submersible mixer seals | No water ingress, oil clear | Pull and inspect | Every 6 months |
| Surface scum blanket | <25 mm | Skim and route to sludge holding | Weekly |
| Cl⁻ ingress (cheese lines) | <0.5 g/L sustained | 316L wetted parts, diversion protocol | Audit at CIP cycles |
DAF and Primary FOG Removal: The Weekly Battleground
DAF is where dairy wastewater maintenance lives or dies. A well-tuned DAF removes 60–90% of TSS and over 90% of FOG when chemistry, hydraulic residence, and air-to-solid ratio are aligned; the moment any one drifts, fat slips downstream and smears the MBR. In high-fat production, the skim hopper should be emptied daily — not "as needed" — because held float re-emulsifies and pumps back into the water column.
Weekly inspections must cover micro-bubble nozzle condition (scaling or biofilm chokes the bubble cloud and halves FOG removal), recycle pump seal integrity, and polymer dose verification. If FOG removal drops below 80% for 48 h, trigger a polymer dose audit before assuming mechanical failure: in most 2024–2026 field cases the cause is upstream, not mechanical. QAC residuals are the most common upstream culprit. Cationic surfactant flips floc charge and collapses the float blanket within minutes of a CIP acid flush arriving at the DAF feed (per Dairy Processing, 2025-07). Operators must coordinate CIP discharge timing with the DAF feed window or install a quench/buffer between the CIP drain and DAF. A dissolved air flotation system with 25–35% recycle and a 4–6 g/L air saturation target handles 0.2–0.4 g/L FOG comfortably when upstream chemistry is controlled.
Route DAF float to a dedicated sludge holding tank, never back into the biological stage — re-emulsified fat coats MBR membranes and is the most expensive fouling event a dairy plant can absorb. For a deeper look at primary treatment selection, see the DAF vs clarifier for food and beverage wastewater 2026 buyer's guide.
| Parameter | Target | Alarm Threshold | Action on Alarm |
|---|---|---|---|
| TSS removal | 60–90% | <60% over 4 h | Check coagulant dose, pH, recycle rate |
| FOG removal | >90% | <80% sustained 48 h | Polymer audit, check for QAC breakthrough |
| Float blanket depth | 50–150 mm | <25 mm or >250 mm | Adjust skim speed, recycle rate |
| Recycle pump pressure | Within ±10% of setpoint | Drift >15% | Inspect nozzle, check seal |
| Skim hopper level | <70% before daily empty | Overflow | Route to sludge holding, not biology |
| Air-to-solid ratio | 0.005–0.015 kg air/kg TSS | Saturation pressure drop >0.2 bar | Clean saturator, inspect compressor |
Biological Treatment and MBR Care: Protecting the Most Sensitive Stage

The biological stage is the most sensitive to upsets, and it is where QAC and peracetic-acid residues from CIP do their quiet damage. Well-tuned MBRs on dairy effluent reach 90% BOD5 and 95% COD removal at OLR ≈5 kg COD/m³·d and ~2-day HRT; UASB on whey hits 89% COD at OLR 11.6 kg COD/m³·d and 1-day HRT (per PMC5434364, 2017). For conventional activated sludge or SBR, target MLSS 3,000–5,000 mg/L, weekly SVI under 150 mL/g, and F/M 0.05–0.15 kg BOD/kg MLSS·d. Whey-strength streams demand F/M at the lower end of that range — high-strength loads at high F/M push filaments and trigger bulking within days.
MBR-specific maintenance is non-negotiable. Schedule in-situ chemical CIP monthly, rotating between NaOCl (500–1,000 mg/L free chlorine, 30–60 min soak) and citric acid (1–2% w/w, pH 2.5–3.0) to remove organic and inorganic foulants. Run a pressure-hold integrity test on every module quarterly; any module losing >0.1 bar/min at 0.3 bar test pressure should be isolated and patched. Aeration scouring must run continuously below the membranes — if the blower output drifts, TMP climbs within days. Trending TMP weekly predicts membrane failure 2–4 weeks before flux loss, so log it every shift.
Coordinate with sanitation whenever CIP strength changes. QAC and peracetic-acid residues above ~5 mg/L cationic surfactant will inhibit nitrification within hours; if a sanitation audit shows excursions longer than 2 h, route the CIP wash to a quench tank or divert biological feed to a holding basin until the spike clears. The integrated MBR membrane bioreactor with DF series flat-sheet MBR membrane module is a common dairy configuration, and the commissioning steps are detailed in the MBR installation and commissioning 2026 engineering guide and the submerged MBR for food processing 2026 engineering specs.
| Parameter | Target | Alarm | Action on Alarm |
|---|---|---|---|
| MLSS (CAS / SBR) | 3,000–5,000 mg/L | <2,500 or >6,000 | Adjust wasting, check wasting rate |
| SVI | <150 mL/g | >200 mL/g | Check F/M, look for filamentous bulking |
| F/M ratio | 0.05–0.15 kg BOD/kg MLSS·d | >0.20 sustained 24 h | Reduce feed or increase wasting |
| MBR TMP | −0.2 to −0.4 bar (clean) | +20–30% over baseline | Schedule chemical CIP within 48 h |
| MBR permeability | Per OEM design spec | Below design >48 h | Run CIP, verify aeration scour |
| Module integrity | <0.1 bar/min decay at 0.3 bar | Any module fails | Isolate, patch, retest |
| NH₃-N in effluent | <5 mg/L (nitrifying) | >15 mg/L sustained | Audit CIP for QAC, check DO >2 mg/L |
Disinfection, Polishing, and Sludge Handling
Downstream stages are routinely under-engineered, and that is where compliance failures quietly originate. For BOD5 under 30 mg/L effluent, UV at 30–40 mJ/cm² delivers reliable disinfection; chlorine dioxide at 0.2–0.5 mg/L residual at the outfall is the alternative where UV transmittance is poor. Probe-check the residual weekly and after any upstream chemistry event — QAC slugs can drive UV transmittance below 40% within minutes and silently pass through disinfection.
Polishing filtration matters whenever reuse is on the table. Cooling-tower makeup or CIP pre-rinse demands SDI under 3; multi-media filter backwash cadence is set by upstream TSS, typically every 24–72 h on dairy service. A multi-media polishing filter with sand, anthracite, and garnet is the most common dairy reuse configuration.
Sludge handling is where dairy operators lose the most money if scheduling slips. Dairy sludge is high in protein and fat, dewatered by plate and frame filter press to 18–25% DS at polymer dose 3–6 kg/t DS. Run dewatering on a fixed weekly schedule — variable scheduling lets sludge go septic, releases ammonia back to the head of the plant, and tanks polymer yield. For disinfection, a chlorine dioxide generator sized for 1–5 mg/L dose handles typical dairy outfall residuals. A polishing train often pairs DAF effluent with a multi-media filter for ultrapure water polish step before reuse.
| Stage | Parameter | Target | Cadence |
|---|---|---|---|
| UV disinfection | Dose | 30–40 mJ/cm² | Continuous, lamp output monthly |
| ClO₂ residual | Outfall | 0.2–0.5 mg/L | Weekly probe |
| Multi-media filter | Backwash interval | 24–72 h | ΔP trigger >0.7 bar |
| Filter effluent SDI | For reuse | <3 | Weekly |
| Sludge dewatering | Cake DS | 18–25% | Weekly batch |
| Sludge dewatering | Polymer dose | 3–6 kg/t DS | Per batch, jar-tested monthly |
2026 Maintenance Schedule and KPI Dashboard

The dashboard below consolidates the cadence and alarm thresholds for every stage of a 100,000–400,000 gal/day dairy wastewater plant. Pin it in the control room and review monthly; the trends it surfaces are what separate a defensible 2026 maintenance program from a reactive one. Note the upstream-to-downstream dependencies: a DAF FOG alarm almost always shows up as an MBR TMP rise 5–10 days later, and a QAC event in equalization will surface as a nitrification failure within 4–6 h.
Digital monitoring turns this schedule from a calendar into a predictive tool. Trending TMP, basin pH, and upstream TSS weekly, with simple control-chart limits, has been shown to predict membrane failure 2–4 weeks in advance (HydropureWater field data, 2026). The single highest-leverage habit is logging TMP daily even when the plant is "running fine" — flatline data is what makes a sudden drift visible.
| Stage | Daily | Weekly | Monthly | Quarterly | Alarm Threshold |
|---|---|---|---|---|---|
| Screens | Rake torque, rag count, hosing | Brush/squeegee check | — | Bearing temp, overload trip test | Downstream rag >3/shift or TSS delta >20% |
| Equalization | pH, temp, scum depth | Surface skim, probe check | — | Mixer seal service, full probe cal | pH swing >1.5 or temp >30 °C |
| DAF | Skim hopper empty, FOG/TSS check | Nozzle, recycle pump, polymer audit | — | Saturator clean, compressor service | FOG removal <80% / 48 h or float collapse |
| Biology / MBR | TMP, DO, MLSS (SBR) | SVI, microscope check | Chemical CIP, MLVSS | Integrity test, blower service | TMP +20–30% or NH₃-N >15 mg/L |
| Disinfection | UV intensity, ClO₂ residual | Probe cal | Lamp replacement schedule | Reactor service | UV <25 mJ/cm² or ClO₂ <0.1 mg/L |
| Sludge | — | Dewatering batch, polymer jar test | Belt/press inspection | Polymer system service | Cake DS <16% or polymer >7 kg/t |
| 30-day rolling | Effluent COD/BOD/TSS log | Trend review | Compliance report | — | COD >permit limit 2 of 30 days |
Troubleshooting Matrix: Symptom to Root Cause to Fix
When a KPI alarm fires, the goal is to route from symptom to root cause in under five minutes. The matrix below covers the four most common 2024–2026 field events in dairy wastewater plants and ties each one to the upstream stage that almost always owns the problem. Treat this as a field card — print it, laminate it, and keep it next to the SCADA station.
| Symptom | Likely Root Cause | Confirm With | Corrective Action |
|---|---|---|---|
| DAF float collapses within minutes | QAC breakthrough from CIP acid flush | Stream pH drop, downstream foam, jar test | Divert CIP drain to quench tank; verify DAF feed pH 6.5–8.0; coordinate CIP timing with DAF feed window |
| MBR TMP rises >20% over 48 h, flux falling | Upstream DAF fat slip, aeration scour loss, or organic fouling | DAF FOG removal trend, blower output, CIP history | Run NaOCl/citric in-situ CIP; verify aeration; if persistent, audit DAF polymer dose and float handling |
| Effluent NH₃-N climbs, nitrification loss | QAC or peracetic-acid inhibition; chloride spike >0.8 g/L | CIP log, Cl⁻ grab, OUR test | Hold biological feed or route to quench tank; recover DO >2 mg/L; restart with seeded biomass if washout |
| Equalization foaming, 22–25 °C summer | High FOG plus warm temperature; possible antifoam depletion | Skim depth, FOG grab, defoamer level | Increase surface skimming to twice weekly; verify antifoam dosing; check upstream fat loads and DAF performance |
Frequently Asked Questions
How often should a dairy DAF be cleaned?
In high-fat lines, the skim hopper should be emptied daily; micro-bubble nozzles and the recycle pump need weekly inspection, and the saturator needs a quarterly clean. If FOG removal stays above 90% and the float blanket is consistent, the cadence is right; if it slips below 80% for 48 h, audit the polymer dose and check for QAC breakthrough before assuming mechanical failure.
What FOG and COD levels define a well-run dairy plant?
Effluent FOG should be under 0.1 g/L in non-cheese lines and under 0.4 g/L in high-fat production, with DAF delivering over 90% FOG removal. Across the biological stage, well-run MBRs hit 90% BOD5 and 95% COD removal at OLR ≈5 kg COD/m³·d and 2-day HRT (per PMC5434364, 2017).
How do quaternary ammonium compounds affect biological treatment?
QAC cationic surfactants disrupt floc formation in DAF, collapsing the float blanket, and inhibit nitrification in the biological stage within hours of a CIP spike above ~5 mg/L. Coordinate CIP discharge timing with the DAF feed window, or route CIP wash to a dedicated quench tank so the biological stage never sees the slug.
When should MBR membranes be chemically cleaned?
Trigger chemical CIP when TMP rises 20–30% above the clean-water baseline or when permeability stays below the OEM design spec for more than 48 h. Rotate between NaOCl (500–1,000 mg/L free chlorine) and citric acid (1–2% w/w) on a monthly cycle to control both organic and inorganic foulants, and re-test module integrity quarterly.
What is the right equalization volume for a 200,000 gal/day dairy?
Size the equalization basin at 25–50% of daily flow — that is 50,000–100,000 gal for a 200,000 gal/day plant — providing 6–12 h of hydraulic retention to flatten the 24-hour production cycle (per PMC5434364, 2017). Confirm working volume quarterly because sediment and dead zones quietly shrink usable capacity.