Why Seattle Data Centers Need a Dedicated Blowdown Strategy
A 50 MW hyperscale build-out in the SPU Cascade or West Seattle service area pulls make-up from Seattle Public Utilities' wholesale surface system (Tolt and Cedar, total hardness 30–60 mg/L as CaCO₃, conductivity 80–150 µS/cm) and discharges cooling-tower blowdown under a King County Industrial Wastewater Discharge Permit issued under King County Code 28.84 to the Brightwater or West Point WRRF. SPU surface water is friendlier than the mineral-rich groundwater that defines Quincy, but discharge rules still bind: temperature ≤40 °C at the point of discharge, pH 5.0–11.0, no free oil/grease, and TDS capped per the permit's local acceptance limits.
Seattle and Quincy are the same state, opposite water profiles. Quincy sits on semi-arid groundwater with TDS above the Washington Department of Ecology's 500 mg/L groundwater guideline; the EPA's Quincy case study documents the Quincy Water Reuse Utility (QWRU) saving 138 million gallons per year (522 million liters per year) by routing blowdown through lime softening and recirculating the treated stream back to Microsoft's data center campus. Seattle's humid-marine climate, low mineral surface source, and abundant rainfall make that exact play unnecessary; what it does not change is the permitting gate. Blowdown is now a discharge-quality and reuse question, not just a water-quantity one — a 100 MW facility can demand up to 2 million liters (~528,000 gallons) of water per day, so even small chemistry or permit errors scale fast.
A February 2026 TNFD case study cited in industry reporting notes that mismanaged evaporative blowdown can carry elevated TDS, heavy metals, and residual biocides and corrosion inhibitors even when the intake is clean. The implication for a Seattle build is direct: source-water quality is not a permit defense, treatment-train design is. Build a train that conditions SPU make-up, drops hardness and silica from blowdown, and concentrates brine to a volume the King County envelope will accept — then layer reuse on top once compliance is locked in.
Cooling-Tower Blowdown Chemistry in the Pacific Northwest
Cycles of concentration (CoC) is the operating knob that sets the blowdown ratio. The math is 1/(CoC − 1): at 4 CoC the blowdown stream equals 25% of make-up volume; at 6 CoC it drops to 20% — a 5 percentage-point gain, not the 50% many sustainability teams assume. That gap is where the chemistry pain hides, because above 5–6 CoC microbiologically influenced corrosion and Legionella risk rise exponentially without an advanced non-oxidizing program or physical disinfection (per Genesis Water Tech).
A typical Seattle blowdown stream at 4–5 CoC off SPU Tolt/Cedar make-up looks like this:
- Ca²⁺ 200–400 mg/L as CaCO₃
- Mg²⁺ 50–150 mg/L as CaCO₃
- SiO₂ 30–80 mg/L (silica is the rate-limiting foulant)
- Cl⁻ 80–200 mg/L
- Conductivity 800–2,000 µS/cm
- pH 7.5–8.8
- Residual phosphonates, dispersants, and oxidizing biocides from the cooling-water program
Three species control whether the train runs clean or fouls: silica (SiO₂), calcium carbonate (CaCO₃), and calcium sulfate (CaSO₄). Conventional brackish RO plateaus at 75–80% recovery before these salts push past induction and nucleate on the membrane; pushing recovery higher without softening or controlled precipitation is how RO skids eat themselves (per IDE Tech). That is the engineering case for softening or weak-acid cation exchange upstream of the membranes on a Seattle site: it removes the scale-forming ions, lets the RO run at a stable local recovery, and pushes the residual brine volume into a manageable concentrate for the King County envelope or a downstream brine stage.
One more flag from the chemistry side: chlorine residual and ORP, free silica, and heterotrophic plate count are the parameters a King County or SPU inspector typically checks first. Build monitoring around those four plus conductivity and pH, and half the permit defense is already done before the audit starts.
Treatment Train Options: Side-by-Side Comparison
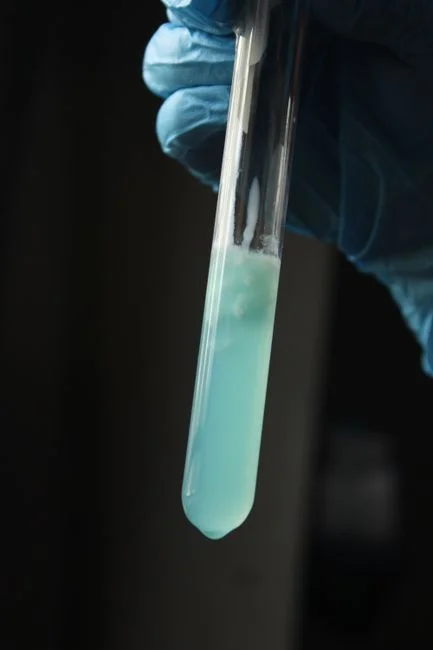
Three realistic process trains cover the discharge-mode choices a Seattle operator will face. Train A is the compliance-only play — softener, sand filter, two-stage RO, sewer discharge under the King County I&I envelope. Train B is the partial-reuse default: weak-acid cation exchange (WAC) plus DAF pre-treatment upstream of RO, brackish RO, then a high-recovery brine stage that concentrates the residual to a small solids-handling stream. Train C is the near-ZLD path for sites with sewer surcharges, restricted discharge windows, or a sustainability mandate that demands near-closed loop. Each train uses multi-media filtration as RO guard and two-stage industrial RO for cooling-tower make-up; the difference is what happens after the concentrate stream leaves stage two.
| Parameter | Train A — Softener + 2-Stage RO | Train B — WAC + DAF + RO + Brine Stage | Train C — UF + RO + MLD Crystallizer |
|---|---|---|---|
| Target recovery | 75–80% (RO) | ~95% (with brine precipitation stage) | ≥97% (up to full ZLD with crystallizer) |
| Blowdown volume reduction vs. sewer baseline | Modest (RO permeate reused, brine to sewer) | 30–50% net make-up reduction (Saltworks 200 MW benchmark up to 40%) | ≥90% liquid discharge eliminated |
| Discharge pathway | King County sewer (Brightwater / West Point) | King County sewer for residual solids; minimal liquid | Solids handling only; near-ZLD |
| Permit complexity | Lowest — standard K.C.C. 28.84 I&I envelope | Moderate — brine chemistry and solids characterization | Highest — pretreatment, MLD/NPDES coordination, residuals |
| Typical CAPEX band per m³/day treated | Lowest of the three | Mid — adds WAC, DAF, and brine reactor | Highest — UF, RO, MVR/crystallizer, solids handling |
| OPEX drivers | Lime/HCl, antiscalant, RO cleaning, sewer surcharge | Regenerant chemicals, seed material replacement, energy | Thermal energy (MVR), seed material, RO CIP, maintenance |
| Best fit (MW scale) | Retrofit on existing SPU-fed sites; <10 MW enterprise | 10–100 MW hyperscale / colocation in Seattle basin | ≥50 MW sites with restricted discharge or high sewer cost |
Default recommendation: Train B for any new hyperscale or colocation build in the SPU service area. It satisfies the King County envelope, converts the largest waste stream into a make-up asset, and keeps the technology stack within what an industrial-water OEM can pre-commission and ship. Train C is the right call only when the sewer surcharge curve, the discharge window, or a corporate water-stewardship target makes the incremental CAPEX pay back inside the asset life. Train A is the retrofit path for legacy sites that need compliance before they need reuse — the Saltworks case data shows preconditioning alone can push cycles of concentration from baseline to 2.5x without major capital. For comparison with peer markets, see our guides on data center cooling blowdown treatment in Austin and data center cooling blowdown treatment in Boston.
Process Parameters, Permit Limits, and a Seattle-Specific Operating Envelope
The table below is the single highest-leverage asset in this article: it consolidates SPU make-up, blowdown at operating CoC, RO permeate, RO concentrate, and the King County discharge envelope into one row set an engineer can paste into a P&ID or permit submittal. PLC-controlled antiscalant and biocide dosing and on-site chlorine dioxide for cooling-loop microbial control tie the chemistry row to the equipment row.
| Parameter | SPU Tolt/Cedar Make-Up | Blowdown at 4–5 CoC | RO Permeate (target) | RO Concentrate | King County Sewer Discharge Limit | Monitoring Point |
|---|---|---|---|---|---|---|
| Total hardness (as CaCO₃) | 30–60 mg/L | 200–400 mg/L | <5 mg/L (post-WAC) | 1,000–2,000 mg/L | Capped per K.C.C. 28.84 acceptance | Online after WAC; lab confirmation weekly |
| Silica (SiO₂) | 5–15 mg/L | 30–80 mg/L | <5 mg/L | 150–400 mg/L | Cap defined in permit; DOE guideline 500 mg/L TDS for groundwater | Online silica analyzer; daily grab |
| Conductivity | 80–150 µS/cm | 800–2,000 µS/cm | <50 µS/cm | 3,000–8,000 µS/cm | Permit-specific (typical <2,000 µS/cm for direct discharge) | Inline at RO feed and concentrate |
| TDS | 50–100 mg/L | 400–1,000 mg/L | <50 mg/L | 3,000–8,000 mg/L | DOE groundwater guideline 500 mg/L is the regional benchmark for any recharge or surface pathway | Lab weekly; online conductivity proxy |
| pH | 7.0–8.2 | 7.5–8.8 | 6.5–7.5 | 7.0–8.0 | 5.0–11.0 (K.C.C. 28.84) | Inline at discharge |
| Temperature | 8–18 °C (seasonal) | 25–35 °C | Ambient | Ambient | ≤40 °C (104 °F) at point of discharge | RTD at discharge |
| Free chlorine / ORP | 0.3–0.8 mg/L (SPU residual) | 0.1–0.3 mg/L | <0.1 mg/L | 0.1–0.5 mg/L | No free oil/grease; residual oxidizer per permit | Inline ORP; DPD weekly |
| Heterotrophic plate count | <100 CFU/mL | 10³–10⁵ CFU/mL above 5 CoC | <1 CFU/mL | Variable | ASHRAE 188 Legionella program on closed loop | Weekly grab; quarterly Legionella per ASHRAE 188 |
| Oil & grease | Trace | Trace | None | None | No free oil/grease at discharge | Visual + periodic lab |
Reference the local acceptance envelope (King County Code 28.84), SPU Water Quality Standards, EPA Cooling Tower Best Management Practices, and ASHRAE 188 for Legionella control on the closed loop. The cycles-of-concentration economics row is the one the CFO will press on: at 4 CoC, blowdown is 25% of make-up; at 6 CoC it falls to 20% — a 5 pp gain that translates to roughly 5–7% lower SPU demand on a 50 MW site, before any blowdown-reuse credit is applied. Use it as an order-of-magnitude figure; the exact number moves with make-up chemistry and the chemistry program.
A Stage-Gated Roadmap from Compliance to Closed-Loop Reuse
The fastest way to lose a capital request is to ask for everything at once. The right shape for a Seattle CFO defense is a stage-gated roadmap where each step unlocks the next funding round on measured savings, not promises. For a 50 MW SPU-fed site, the phasing below is what we would brief to finance.
- Stage 1 — Measure & baseline. Install make-up, blowdown, and discharge flow meters; add online conductivity, pH, and silica on the blowdown and RO loops. This is the cheapest and most defensible first step and the one most facilities skip. Tie the output to a recycled-water expansion narrative (the AWS commitment to preserve over 530 million gallons of drinking water annually across its U.S. fleet is a defensible external benchmark for hyperscale ESG reporting).
- Stage 2 — Optimize cycles. Repair leaks, retune chemical feed, add side-stream filtration, and move from 4 CoC to 5–6 CoC safely. Biological and scaling risk rises exponentially above 5–6 CoC without advanced treatment or non-oxidizing microbial control (per Genesis Water Tech), so do not skip the chemistry program redesign that goes with this stage.
- Stage 3 — Blowdown reuse to make-up. Deploy two-stage industrial RO for cooling-tower make-up plus a brine-reduction stage. The Saltworks 200 MW case data shows up to a 40% reduction in evaporative cooling water consumption through staged enhanced water recovery — that is the defensible benchmark for a Seattle site targeting 30–50% net make-up reduction at 50 MW. For an OPEX-aware buildout, see the RO system maintenance cost OPEX breakdown for 2026 and the cross-reference on membrane bioreactor versus conventional biological treatment if the site adds a sanitary side stream later.
- Stage 4 — MLD or targeted ZLD. Add a brine crystallizer (MVR or fluidized-bed reactor) only when the sewer surcharge curve or a restricted discharge window makes the incremental CAPEX pay back. IDE Tech's high-recovery configuration operates at ~95% recovery with permeate silica around 1 mg/L — the engineering precedent for the high-recovery brine stage in Train B and Train C.
Indicative envelope for a 50 MW Seattle site, not a quote: Stage 1 typically under $100K and 2–4 months; Stage 2 under $250K and 3–6 months; Stage 3 $1.5–4M over 9–14 months. The Saltworks 200 MW benchmark (blended cost line in their case study) is the reference point to defend Stage 3 against finance; the Saltworks case explicitly blends CAPEX (15-year, 12%) and OPEX into a $/m³ figure for each successive EWR stage. Use that blended-cost logic in the CFO deck and the conversation shifts from "how much water" to "what is the all-in cost per cubic meter of recovered make-up."
Frequently Asked Questions
What permit does a Seattle data center need to discharge cooling-tower blowdown?
Discharge to the King County sewer system (Brightwater or West Point WRRF) requires an Industrial Wastewater Discharge Permit under King County Code 28.84, with temperature ≤40 °C, pH 5.0–11.0, no free oil/grease, and TDS capped per the local acceptance limits set in the permit. For any on-site recharge or surface pathway, the Washington Department of Ecology's 500 mg/L TDS groundwater guideline is the de facto benchmark regional wastewater plants use.
Why does conventional RO plateau around 75–80% recovery on cooling-tower blowdown?
Silica (SiO₂), calcium carbonate, and calcium sulfate concentrate as water evaporates, and conventional brackish RO has no mechanism to remove them before they nucleate on the membrane surface. Above 75–80% local recovery, induction times collapse, scaling risk rises sharply, and chemical-cleaning frequency erodes uptime. Softening, weak-acid cation exchange, or a high-recovery brine stage (such as a fluidized-bed crystallizer operating at ~95% recovery with permeate silica near 1 mg/L) is what unlocks stable operation above the conventional ceiling.
What CAPEX should a 50 MW Seattle data center plan for blowdown treatment?
Indicative and not a quote: Stage 1 (metering and baseline) typically under $100K, Stage 2 (cycles optimization) under $250K, and Stage 3 (two-stage RO with brine reduction) $1.5–4M over 9–14 months. The Saltworks 200 MW case study is the defensible external benchmark — its blended CAPEX-plus-OPEX line shows the all-in cost per cubic meter of recovered make-up at each successive enhanced water recovery stage, which is the right framing for a CFO conversation.
How does Seattle's climate change the blowdown math versus arid U.S. sites?
Seattle's humid-marine climate lowers evaporative cycles relative to Phoenix or Quincy, so the absolute blowdown volume is smaller per MW, but cycles of concentration still cap at 5–6 without advanced treatment because biological and silica scaling risk rises exponentially above that band. The SPU surface source (Tolt/Cedar, 30–60 mg/L total hardness) makes the make-up easier to condition than Quincy groundwater, which is why a Train B weak-acid-cation + RO + brine-recovery design is the default fit here rather than the lime-softening-first approach Quincy uses.