

Why Austin Data Centers Need a Location-Specific Blowdown Design
Peak wet-bulb in Austin runs 26–28 °C in July and August, against 18–21 °C in December and January, so evaporative cooling duty at the same IT load roughly doubles between winter and summer. Blowdown volume tracks that swing at 2–3×, which is why trains sized to annual average undersize in July. Make-up water is the Edwards Aquifer blended seasonally with surface water from Austin Water; calcium runs 80–130 mg/L and bicarbonate alkalinity 150–220 mg/L as CaCO3, both higher than Dallas Trinity River supply, which shifts inhibitor selection and Langelier Saturation Index (LSI) targets (per Lone Wolf Austin profile, 2025-08). Pushing cycles of concentration (CoC) on that chemistry without softening blows past the silica ceiling fast.
TCEQ holds operators accountable under the Texas Pollutant Discharge Elimination System (TPDES) whether discharge goes to Austin Water's publicly owned treatment works (POTW), to surface water, or to a reclaimed-water reuse system. ASHRAE 188 Water Management Program (WMP) documentation layers on top of that for any on-site cooling tower, because Texas healthcare, hospitality, and mixed-use campuses in Austin all carry the Legionella compliance load (per Lone Wolf Austin profile, 2025-08). National context: a 100 MW facility can use up to 2 million liters of water per day (per IDE Tech, 2026), and the U.S. data center industry directly or indirectly draws water from 90% of U.S. watersheds. USGS SIR 2014-5184 estimated U.S. thermoelectric withdrawal at 129 Bgal/d with 3.5 Bgal/d consumption in 2010, and reported an 18% withdrawal and 34% consumption decline from 2005 to 2010. That consumption number is where efficiency programs actually score, and it is the part a generic template misses.
The Two Effluent Streams: Sanitary and Cooling-Tower Blowdown
Stream 1 — Sanitary. Restrooms, break rooms, kitchens, and any on-site laundry. Flow is intermittent and tied to headcount, typically 50–100 L per employee per shift. Loading runs low-COD on average but spikes in BOD, ammonia, and pathogens when kitchen disposals are routed in. A packaged biological plant with disinfection handles this stream cleanly at 1–80 m³/h and is sized off peak-shift occupancy, not IT load. Austin practice: a buried A/O package plant such as a WSZ underground A/O package plant with downstream chlorination or UV, discharged to the sanitary sewer or routed to a TCEQ on-site sewage facility (OSSF) for subsurface irrigation where the site lacks a POTW connection.
Stream 2 — Cooling-tower blowdown. Continuous, scales with IT load and ambient wet-bulb. Carries the concentrating effect of every cycle: TDS, hardness, silica, scale-inhibitor residuals, oxidizing biocide byproducts. Volume swings 2–3× between winter and summer at the same site, which is why the blowdown train is sized for peak summer duty. A site-specific third stream — humidification bleed-off, once-through adiabatic cooler reject, or boiler blowdown from an on-site heat plant — appears on roughly one-third of Central Texas projects. Treat it as a side-stream: high temperature, low volume, does not blend well with either sanitary or cooling blowdown.
Why segregation matters: matched unit operations outperform catch-all designs. Blending forces an oversized train that handles neither stream within compliance limits. The rule for Austin is to keep sanitary and blowdown in parallel trains, sized to their own peak loads, with the discharge path selected before equipment specification.
Austin Raw-Water Parameters and Cycles-of-Concentration Ceiling
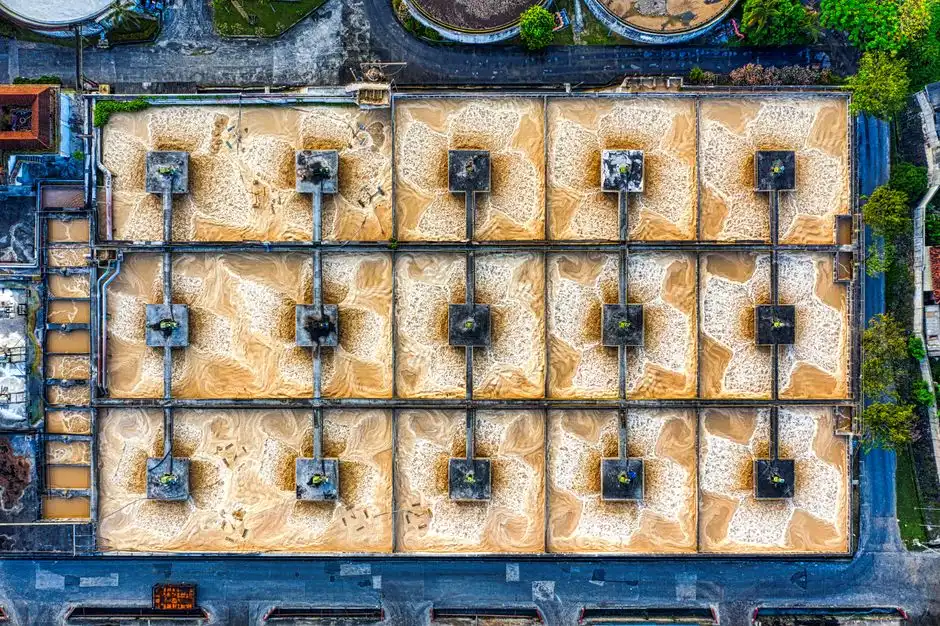
The numbers below are the 2026 design basis for an Austin data center. They come from HydropureWater field data and the Austin Water published surface-water profiles (consistent with the Dallas-style basis laid out in the Dallas data center blowdown treatment guide, adjusted upward for Edwards Aquifer calcium and bicarbonate).
| Parameter | Typical Austin make-up range | Design implication |
|---|---|---|
| pH | 7.5–8.3 | LSI shift at high CoC; controls inhibitor dose |
| Total hardness (as CaCO3) | 180–280 mg/L | Sets lime/soda or IX demand for softening |
| Alkalinity (as CaCO3) | 150–220 mg/L | LSI ceiling at +0.5 reached at ~5 CoC without softening |
| Calcium | 80–130 mg/L | Higher than DFW; forces earlier softening |
| Silica | 12–25 mg/L | ≤150 mg/L at 40 °C ceiling; hard cap on CoC |
| TDS | 250–450 mg/L | Drives TPDES compliance path selection |
| Chloride | 15–35 mg/L | Concentrates at CoC; TPDES aquatic-life limit |
| Sulfate | 20–50 mg/L | Concentrates at CoC; calcium sulfate scaling risk |
| Conductivity | 400–700 µS/cm | Online CoC control loop |
| Cycles of concentration | 4–6 (most Austin sites) | Softening required above ~5 CoC |
| Silica at 40 °C ceiling | ~150 mg/L | Defines absolute CoC upper bound |
The CoC ceiling is set by the most limiting of: LSI at +0.5 or lower, silica solubility at ≤150 mg/L at 40 °C, or the biocide regime's demand for a residual-free blowdown window. Most Austin cooling systems run 4–6 cycles; pushing to 7+ without softening hits the silica ceiling quickly. Blowdown ratio math: blowdown = 1/(CoC−1) of make-up (per Genesis Water Technologies, 2026-01). At 4 CoC that is 25%; at 6 CoC that is 20%. The 4→6 CoC move is a 5-percentage-point, 20% improvement in blowdown volume, not 50%. Blowdown is 20–40% of intake water in conventional systems; a 10 MW facility at 4 CoC intakes roughly 15 million gallons monthly and discharges about 3.75 million gallons as blowdown (per Genesis, 2026-01).
Industry Water Usage Effectiveness (WUE) sits at 0.47–0.65 Gal (1.8–2.5 L) per kWh (per Genesis, 2026-01). WUE alone hides blowdown loss because it does not distinguish consumption (evaporation + incorporation) from usage (consumption + returned-to-source). A facility with low WUE can still be discharging contaminated blowdown at scale.
Six-Step Austin Blowdown Treatment Train
Step 1 — Equalization. Balance the 2–3× seasonal flow swing and dampen shock loads from batch tower dumps. Include a dedicated sanitary equalization basin in parallel. Sized to 30–60 minutes of peak blowdown flow for the cooling side; sized to peak-shift occupancy for the sanitary side.
Step 2 — Softening and clarification. Lime/soda or ion-exchange softening to drop calcium and silica below the CoC ceiling. Pair with a lamella clarifier for softening and pretreatment to drive surface loading to 20–40 m/h and cut chemical consumption by roughly 30% versus a conventional clarifier. This is the step that lets an Austin plant hold 5–6 CoC reliably.
Step 3 — Side-stream filtration. A multi-media filter for SDI reduction bringing the Silt Density Index (SDI) below 3, which is the level that protects downstream RO membranes. Automated backwash is standard scope, sized to a 5–10 minute cycle to keep turbidity under 1 NTU upstream of the RO.
Step 4 — Reverse osmosis polishing. An industrial RO system at 60–75% local recovery producing cooling-tower make-up quality permeate. Conventional BWRO plateaus at 75–80% recovery before scaling becomes unmanageable (per IDE Tech, 2026). For high-recovery reuse, closed-loop designs that combine controlled salt precipitation with dynamic RO cycling reach about 95% recovery with permeate silica at ~1 mg/L, which is the design point that makes blowdown-to-make-up reuse economic.
Step 5 — Disinfection. A chlorine dioxide generator for residual disinfection across the cooling loop and the reuse distribution. ClO2 holds residual across a wider pH band than free chlorine and forms fewer regulated DBPs at the typical Austin blowdown pH range. Pair with a plate-and-frame filter press on the softening-sludge sidestream to drop sludge volume and reach a 25–35% dry solids cake.
Step 6 — Discharge or reuse routing. Select the regulatory path (POTW, TPDES surface water, or Title 30 TAC Chapter 210/213 on-site reuse) before specifying equipment, because the design basis changes with each path. For comparison, the equivalent process architecture in a hot, dry climate is detailed in the Dammam data center blowdown and ZLD design, and brackish water RO sizing is broken down in the brackish water RO selection guide.
TCEQ Discharge Paths: POTW vs TPDES vs On-Site Reuse
Discharge route selection precedes equipment specification, because each path drives a different design basis, capital envelope, and permit timeline.
| Path | Governing rule | Limits to engineer for | Permit lead time | CAPEX posture | Best fit for Austin |
|---|---|---|---|---|---|
| A — Sanitary sewer (POTW) | Austin Water Chapter 14 + TPDES pretreatment | pH, temperature, metals, oil/grease, slug control | 30–90 days (modification) | Lowest | Sites with existing POTW tie-in and no ESG reuse mandate |
| B — Surface water (TPDES outfall) | TPDES permit + Texas Surface Water Quality Standards | TDS, chloride, sulfate, metals, temperature, residual Cl2 | 9–18 months for a new outfall | Highest (permit capital + DMR program) | Sites with no POTW and large site footprint for outfall |
| C — On-site reuse | Title 30 TAC Chapter 210/213 reclaimed-water framework | BOD/TSS/TDS reuse-class limits, residual, cross-connection control | 60–180 days registration | Moderate (RO polishing + distribution) | Hyperscale and colocation with corporate WUE targets |
| D — ZLD (mechanical evap + crystallizer) | Site-specific zero-discharge covenant or landfill-liquid restriction | Zero liquid discharge; solids handling only | Project-specific | Highest CAPEX and OPEX | Niche: no POTW, zero-discharge covenant |
Reuse becomes economically attractive once blowdown TDS clears 1,500 mg/L. Austin blowdown at 4–6 CoC lands in the 800–1,800 mg/L TDS window depending on the make-up blend, so the ROI tipping point is site-specific. Path C is the path most hyperscalers are converging on because it neutralizes TPDES permit risk and the long-term water-cost trajectory. Path B remains the right call where the site lacks a POTW and the operator is willing to absorb a 9–18 month outfall schedule. Path D is reserved for sites with a zero-discharge covenant, no POTW access, or landfill-liquid restrictions, and it carries the highest CAPEX and OPEX of the four options.
Austin ROI: Total Cost of Water, Not Just the Utility Bill
The defensible business case is built on avoided costs, not just water savings. Components include Austin Water commercial/industrial rates, peak-day surcharges, wastewater discharge fees, and avoided TPDES outfall permit capital — the last item often runs six figures for a new surface-water discharge. The Genesis benchmark (2026-01) for a 15 MW facility in a water-stressed region recovering 60% of blowdown at $200,000 capital shows 6.7-year simple payback on water alone, but that calculation typically omits avoided wastewater fees, avoided peak demand charges, deferred capacity expansion, and ESG/WUE disclosure value. With those factors, payback drops to 3–5 years.
An Austin-specific sketch: a 10 MW facility at 4 CoC discharges roughly 3.75 million gallons of recoverable blowdown monthly (per Genesis, 2026-01). At any non-trivial Austin Water rate, that is a six-figure annual avoidable cost before counting avoided peak demand charges and TPDES permit exposure. The 9–18 month outfall timeline for a new surface-water discharge (per the Dallas basis in S5) is a real schedule risk that on-site reuse avoids. Closing the case: water reuse, closed-loop cooling, and advanced treatment are trending toward baseline requirements for long-term viability in the data-center sector (per IDE Tech, 2026), not optional add-ons. A facility that hands procurement a CoC ceiling, a unit-operation list, and a discharge-path matrix with avoided-cost line items is the facility that clears internal review.
Frequently Asked Questions
What cycles of concentration should an Austin data center design its cooling tower for?
4–6 cycles is the realistic band on Edwards Aquifer make-up water without softening. The hard ceilings are silica at ~150 mg/L at 40 °C and Langelier Saturation Index at +0.5 or lower (per Genesis, 2026-01; consistent with the Dallas basis in S5). Pushing past 6 cycles without softening or RO pretreatment hits the silica ceiling fast.
Which TCEQ path applies to a cooling-tower blowdown discharge in Austin?
Three paths cover most cases: sanitary sewer under Austin Water Chapter 14 plus TPDES pretreatment, surface water under a full TPDES permit with Texas Surface Water Quality Standards, or on-site reuse under Title 30 TAC Chapter 210/213. Permit lead time ranges from 30–90 days for a sewer modification to 9–18 months for a new surface-water outfall.
Does Austin raw water really need softening for a 5-cycle cooling system?
Yes. Edwards Aquifer make-up water runs 80–130 mg/L calcium and 150–220 mg/L bicarbonate alkalinity as CaCO3, which puts LSI above +0.5 by roughly 5 cycles without inhibitor adjustment. Softening (lime/soda, ion exchange, or RO) is what makes a 5–6 cycle operating point defensible on Austin water.
What is a defensible Austin blowdown treatment train?
Six steps: equalization, softening and clarification with a lamella clarifier, side-stream multimedia filtration, RO polishing, chlorine dioxide disinfection, and discharge or reuse routing. A plate-and-frame filter press handles the softening-sludge sidestream.
How much blowdown does a 10 MW Austin data center actually produce?
At 4 cycles of concentration, roughly 3.75 million gallons per month of recoverable blowdown on a 15-million-gallon monthly intake (per Genesis, 2026-01). At 6 CoC, that drops to about 3 million gallons monthly, a 20% improvement in blowdown volume, not 50%.
For a site-specific sizing review, send the make-up water analysis, peak IT load, and target CoC to a process engineer who can model the train against Austin Water and TCEQ permit constraints before equipment selection.