Why Stavanger Hospitals Are Under Renewed Pressure to Treat On-Site
Hospital wastewater in Stavanger must meet Norwegian Water Regulation §§30–36 effluent limits while controlling the antibiotic-resistance-gene load that the 2024 Norwegian four-WWTP study showed persists at municipal plants. A 2026-ready train — rotary screening, equalization, MBR (0.1 μm PVDF), and on-site ClO₂ or ozone — reliably delivers BOD ≤25 mg/L, COD ≤125 mg/L, TSS ≤30 mg/L, and >99% pathogen kill in a footprint that fits a SUS-scale or packaged clinic site.
The 2024 Frontiers in Antibiotics study of four Norwegian WWTPs found measurable antibiotic residues and ARGs in treated effluent despite Norway's strict antibiotic stewardship — and explicitly recommended at-source hospital effluent pretreatment as a complement to national policy (Frontiers in Antibiotics, 2024). For Stavanger, where Stavanger University Hospital (SUS), the private clinics in Sandnes, and the day-surgery centers all discharge to the IVAR-region municipal sewer, the implication is direct: every facility upstream is seeding the downstream biological stage with mobile genetic elements and sub-inhibitory antibiotic concentrations. The PMC review of hospital wastewater (2020) further documents that hospital effluents carry higher COD, TSS, and pharmaceutical loads than domestic sewage, and that SARS-CoV-2 RNA monitoring in hospital wastewater is now embedded in European public-health surveillance practice — meaning the regulatory scope is widening from BOD/COD to include pathogen-RNA and ARG endpoints.
The driver stack in 2026 is therefore dual: a tightening Norwegian Water Regulation framework under §§30–36, plus an AMR evidence base that the "pretreat-then-sewer" model no longer satisfies. Engineers planning new builds or retrofits should treat hospital wastewater management as a clinical-infection-control adjacency, not a janitorial utility. The downstream sections translate this into compliance numbers, an MBR + ClO₂/ozone process train, and three tiered equipment packages sized to the Rogaland hospital stock. For the membrane side specifically, the engineering priorities follow the same fouling-prevention logic laid out in the MBR membrane-fouling prevention guide.
Norway and EU Discharge Rules a Stavanger Hospital Must Hit in 2026
EU Urban Waste Water Treatment Directive 91/271/EEC sets the baseline for urban and hospital discharges, and the 2024 EU evaluation cycle has sharpened member-state attention on micropollutants and pharmaceutical residues — Norway, as an EEA member, applies the directive through the Norwegian Water Regulation (Forskrift om rammer for vannforvaltningen). Sections 30–36 establish minimum environmental quality standards for discharges to receiving waters, and the regional pretreatment bylaws adopted by the IVAR-fasjonen for the Stavanger/Sandnes/Dalane corridor typically require stricter local limits than the national floor.
A 2026 design for any Stavanger hospital or clinic should anchor to the following envelope: BOD₇ ≤25 mg/L, COD ≤125 mg/L, TSS ≤30 mg/L, total nitrogen per the receiving POTW's pretreatment letter, total phosphorus per the same letter, and E. coli ≤100 CFU/100 mL where on-site reuse is contemplated. For facilities reusing treated effluent for laundry, cooling-tower make-up, or toilet flushing, EU 98/83/EC drinking-water quality is not required, but the WHO 2006 guidelines for non-potable reuse and SS 820 000 (the Norwegian standard for greywater/reuse systems) typically govern microbial and chemical targets. The integrated MBR + ClO₂ train specified later in this article is explicitly certified to 91/271/EEC discharge requirements, which gives Stavanger procurement a clean audit trail.
Sending untreated hospital effluent to the municipal sewer remains legally permissible in some configurations, but in 2026 it is a non-default position: the AMR evidence, the SARS-CoV-2 surveillance expectations, and the tightening of municipal pretreatment bylaws in Rogaland have all raised the cost-benefit line. The compliance map below summarizes the operative limits and their source documents.
| Parameter | 2026 design target (Stavanger hospital) | Source / legal basis |
|---|---|---|
| BOD₇ | ≤25 mg/L | EU 91/271/EEC; IVAR pretreatment bylaws |
| COD | ≤125 mg/L | EU 91/271/EEC; Norwegian Water Regulation §§30–36 |
| TSS | ≤30 mg/L | EU 91/271/EEC; receiving POTW letter |
| Total nitrogen | Per POTW pretreatment letter (typically 10–25 mg/L) | Norwegian Water Regulation §§30–36 |
| Total phosphorus | Per POTW pretreatment letter (typically 1–2 mg/L) | Norwegian Water Regulation §§30–36 |
| E. coli | ≤100 CFU/100 mL for reuse | WHO 2006 reuse guidelines; SS 820 000 |
| Pathogen / ARG load | At-source reduction target | Frontiers in Antibiotics 4-WWTP study, 2024 |
Influent Reality Check: What Stavanger Hospital Streams Actually Contain
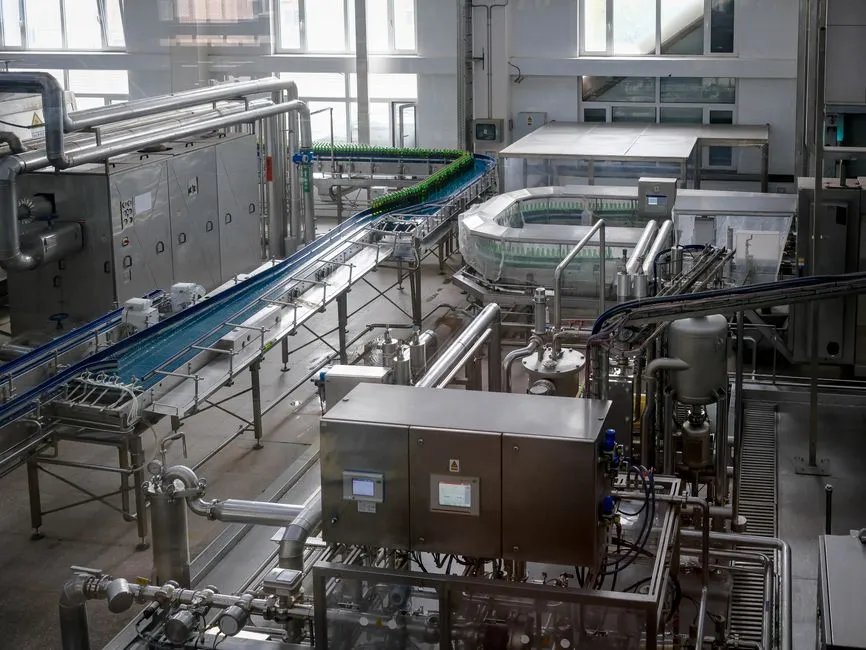
The PMC review (2020) characterizes hospital effluent with COD 120–500 mg/L, TSS 150–160 mg/L, pharmaceutical-active compounds (PhACs), antibiotic residues, disinfectants, and pathogens. Average BOD across European and Asian hospitals sits near 200 mg/L — a useful design anchor for the MBR biological stage at any new Stavanger facility. Compared with domestic sewage, hospital streams concentrate PhACs roughly 5–10× and disinfectant-quaternary-ammonium-compound residues 10× or higher in wards with active infection-control cleaning.
Per-bed water demand defines the hydraulic envelope. Developing-country acute hospitals average around 250 L/patient/day; developed-country acute hospitals including Norwegian SUS-scale facilities commonly reach 400–600 L/patient/day, with outpatient and surgical loads adding another 50–100 L/visit. Diurnal peaks are real: weekday surgical programs generate 1.5–2× the night flow, so equalization tanks sized for 8–12 h HRT are standard practice. The 30 m³/day MBR design used for a 60-bed dialysis clinic illustrates the envelope — that case study shows how the same influent envelope scales down for satellite facilities.
Dialysis-loop effluents deserve a separate note. Spent dialysate carries high BOD/COD and trace metals; routing it through the equalization stage ahead of the MBR, rather than bypassing pretreatment, prevents shock loads. For an actual reference design at this scale, the 30 m³/day dialysis-center MBR case study documents a working envelope that translates directly to a SUS satellite.
| Parameter | Typical hospital influent range | MBR design anchor (Stavanger) |
|---|---|---|
| COD | 120–500 mg/L | Use 400 mg/L for sizing |
| BOD₇ | ~200 mg/L (EU/Asia average) | 200 mg/L for biological capacity |
| TSS | 150–160 mg/L | 200 mg/L with peak factor |
| Per-bed water use | 400–600 L/patient/day (developed-country acute) | 500 L/patient/day for new builds |
| Diurnal peak factor | 1.5–2× average | 2× for equalization sizing |
| Equalization HRT | 8–12 h | 10 h nominal |
The 2026 Process Train Built for a Stavanger Site
The recommended unit-operation sequence for a 2026 Stavanger hospital plant is screening → grit/flow splitting → equalization → DAF (when oil/grease loads are high) → MBR → ClO₂ or ozone → sludge dewatering. Each stage maps to equipment with published datasheet performance, which simplifies P&ID work and procurement specifications.
- Stage 1 — Headworks screening. A GX rotary bar screen for headworks with 3–5 mm aperture protects downstream MBR cassettes from fibrous and surgical-tray debris. Stainless rake teeth and dual overload protection are standard.
- Stage 2 — Equalization. An 8–12 h HRT tank with mechanical mixers and pH/temperature probes absorbs the 1.5–2× diurnal peak and keeps the MBR feed within a stable envelope.
- Stage 3 — DAF (when applicable). For large kitchens, surgical-instrument wash, or laundry discharge, a DAF unit (4–300 m³/h) removes emulsified oils, surfactants, and floatables before they reach the membranes.
- Stage 4 — MBR biological stage. Either a packaged integrated MBR system for hospital effluent (10–2,000 m³/day) or skid-mounted DF-series flat-sheet MBR modules (0.1 μm PVDF, 32–135 m³/day per cassette). The DF flat-sheet geometry handles suspended solids better than hollow-fiber in a hospital matrix and simplifies CIP.
- Stage 5 — Disinfection. Either a ClO₂ generator (50 g/h to 20,000 g/h) for sites with on-site precursor chemical storage, or a packaged hospital wastewater system with integrated ozone for chemical-free sites. Both deliver >99% pathogen kill.
- Stage 6 — Sludge dewatering. A plate-and-frame filter press for hospital sludge dewaters the small MBR waste-sludge volumes to a category-B manageable cake for high-temperature incineration pickup.
| Stage | Equipment | Operating range | Role |
|---|---|---|---|
| 1 | GX rotary bar screen | 3–5 mm aperture | Fiber and debris removal |
| 2 | Equalization tank | 8–12 h HRT | Peak shaving, pH/temp probe |
| 3 | DAF (optional) | 4–300 m³/h | Oil/grease/surfactant removal |
| 4 | DF-series MBR cassettes / integrated MBR | 32–135 m³/day per cassette; 10–2,000 m³/day packaged | BOD/COD/TSS reduction, biological stage |
| 5 | ClO₂ generator or ozone | 50 g/h – 20,000 g/h ClO₂; 99%+ kill | Disinfection for discharge or reuse |
| 6 | Plate-and-frame filter press | Cake DS up to 30–35% | Sludge dewatering to category-B cake |
Stavanger Equipment Sizing: Packaged Unit vs. Full MBR vs. Sewer-Only
Three deployment tiers cover the Stavanger hospital stock. Tier 1 suits small clinics and day-surgery centers up to 10 m³/day; the packaged unit occupies roughly 0.5 m², runs on ozone with no chemical dosing, and is certified to EU 91/271/EEC. CAPEX for this tier falls in the NOK 200,000–600,000 range, with OPEX dominated by power consumption for the ozone generator. Tier 2 covers mid-size private hospitals at 10–50 m³/day — a containerized MBR + ClO₂ with a single DF-series cassette and a plate press for sludge, in the NOK 1.5–4 million CAPEX band. Tier 3 is the SUS-scale or large regional hospital above 50 m³/day, with multiple DF cassettes, a full ClO₂ system, and treated-effluent reuse for laundry and cooling-tower make-up; CAPEX lands in the NOK 5–20 million range, with OPEX dominated by membrane aeration and ClO₂ precursor cost.
The sewer-only baseline — zero CAPEX, no on-site plant — remains technically lawful where the receiving POTW accepts the load, but it carries rising risk: ARG and PhAC scrutiny, IVAR pretreatment-bylaw tightening, and the loss of any on-site water-reuse credit. Where reuse is contemplated, MBR + ClO₂ effluent meets EU 98/83/EC and WHO guidelines for non-potable end uses, and reuse can offset 30–60% of OPEX in larger facilities by displacing purchased municipal water.
| Tier | Facility profile | Recommended system | CAPEX band (NOK) | OPEX driver |
|---|---|---|---|---|
| 1 | Clinic / day-surgery ≤10 m³/day | Packaged (ozone) | 200,000–600,000 | Ozone power |
| 2 | Private hospital 10–50 m³/day | Containerized MBR + ClO₂, single DF cassette | 1,500,000–4,000,000 | Membrane aeration, ClO₂ precursor |
| 3 | SUS-scale / regional >50 m³/day | Custom MBR, multiple DF cassettes, full ClO₂, reuse | 5,000,000–20,000,000 | Aeration, ClO₂ precursor, sludge handling |
| Baseline | Any | Discharge to municipal sewer only | 0 | POTW fees, AMR/micropollutant risk |
Operational Pitfalls Specific to Norwegian Hospital Conditions
Stavanger winter inlet temperatures sit around 4–8 °C; below 10 °C, MBR biology slows measurably and nitrification rates drop. Covered and insulated biological tanks, or trace heating of the mixed-liquor return, hold biology inside its design window. Membrane fouling is the next-most-common failure mode, and the seven countermeasures documented in the MBR membrane-fouling prevention guide — including relaxation cycles, periodic chemical backwash, and maintaining sub-critical flux — apply directly to DF cassettes under Norwegian load patterns.
Disinfection demand is not constant. Surgical-week peaks drive ClO₂ demand spikes 1.3–1.5× above average, and undersized generators produce under-disinfection events. Spec the ClO₂ generator to 1.5× the average calculated dose. Finally, hospital sludge is a category-B biohazard; sealed handling from the MBR waste-activation tank through the plate press to contractor pickup for high-temperature incineration is non-negotiable under Norwegian waste-handling rules.
Frequently Asked Questions
What effluent limits apply to hospital wastewater in Stavanger in 2026?
Norwegian Water Regulation §§30–36 plus the receiving POTW (typically IVAR) pretreatment letter. Practical design targets: BOD₇ ≤25 mg/L, COD ≤125 mg/L, TSS ≤30 mg/L, E. coli ≤100 CFU/100 mL for reuse. The integrated MBR + ClO₂ train specified in this article is certified to EU 91/271/EEC.
Can a small clinic in Stavanger use a packaged unit instead of a full MBR?
Yes. The packaged hospital wastewater system covers ≤10 m³/day, occupies roughly 0.5 m², and uses ozone to deliver >99% disinfection with no chemical dosing. It is explicitly certified to EU 91/271/EEC discharge requirements, which is the compliance anchor Stavanger procurement needs.
Why is on-site hospital wastewater treatment becoming mandatory in Norway?
The 2024 Frontiers in Antibiotics study of four Norwegian WWTPs documented ARG and antibiotic-residue persistence in municipal effluent even under strict antibiotic-use policy. At-source hospital effluent pretreatment is the explicit recommendation in that paper; the Norwegian Water Regulation and IVAR pretreatment bylaws are tightening in parallel.
How much does a hospital wastewater plant cost in Stavanger?
For a packaged clinic unit, roughly NOK 200,000–600,000. For a mid-size private hospital with a containerized MBR + ClO₂, NOK 1.5–4 million. For a SUS-scale custom MBR + ClO₂ with on-site reuse, NOK 5–20 million. OPEX is dominated by membrane aeration and ClO₂ precursor in the larger tiers.
Can treated hospital wastewater be reused on site?
Yes. MBR + ClO₂ effluent meets EU 98/83/EC and WHO 2006 guidelines for non-potable end uses such as laundry, cooling-tower make-up, and toilet flushing. Where reuse displaces purchased municipal water, it typically offsets 30–60% of plant OPEX in larger facilities.