Why Potato Starch Wastewater Is an RO Application
A 30 t/d potato starch plant pushes roughly 14 t/d of nonstarch solids into its waste stream — protein, fiber, sugars, and ash that the process does not capture as saleable product (per the Springer 1970 chapter on RO for potato-starch waste). The same source gives the average composition of processed tubers: 13% starch, 2% protein, 1.5% cellulosic material, 0.5% sugars, and 81% water. Those fractions define both the resource to recover and the fouling load that any downstream membrane has to survive.
RO sits at the end of a recovery train, not at the front. Settling, screening, centrifuging, and UF/NF recover the bulk starch and protein as by-product; RO polishes the remaining wash water so it can be either reused in the process or discharged to a sewer under a tightening effluent permit. The 2023 UF/NF pilot on potato processing water demonstrated roughly 80% water recovery in an integrated membrane train (PMC, 2023), and historical references going back to the 1970s confirm that the UF→RO architecture is a proven, decades-old approach to potato fruit water — not a speculative bet (PMC, 2023, citing earlier work; Springer, 1970). The capital case for adding an RO stage is therefore straightforward: every cubic meter of permeate that you can recycle back into fluming or starch washing displaces fresh water intake and reduces the load on the downstream biological or evaporation step.
Feed Characterization: What You're Putting Into the RO
Before any sizing math, the engineer needs a complete feed profile. The minimum parameter set is flow (m³/d, average and peak), temperature (°C), pH, total suspended solids (TSS), COD/BOD, total starch, total protein, conductivity, and silt density index (SDI). On a starch plant, total starch and total protein dominate membrane design — not conductivity, the way they would for a brackish groundwater RO feed. The Springer 1970 composition table makes the point: at 2% protein on fresh tuber weight and high suspended starch carryover, organic fouling is the binding constraint on flux and recovery.
The cited 2023 pilot used a flat-sheet membrane with an effective area of 1.4×10⁻² m², which is roughly the size of a sheet of printer paper (PMC, 2023). That number is useful only as a reminder that pilot flux values are membrane-area-specific and do not scale linearly to industrial 8-inch elements (~35–40 m² each) without re-checking against the manufacturer's spec sheet at the chosen recovery and temperature. The same source reports an operating window of 1.0–1.8 MPa for nanofiltration on potato processing water, which sets the lower bound for a brackish-water RO stage on the UF permeate. Aim for an SDI below 3 on the RO feed, or below 5 with a derated design flux, to keep particulate and colloidal fouling under control.
| Parameter | Typical range / target | Source |
|---|---|---|
| Feed flow (design basis) | Plant-specific; 10–20 m³ per ton of starch processed | Springer 1970 (process context) |
| Total starch (UF permeate) | < 50 mg/L target for RO protection | Engineering practice, starch industry |
| Total protein (UF permeate) | < 100 mg/L target; proteins foul PES rapidly | PMC, 2023 |
| SDI (RO feed) | < 3 preferred; < 5 with conservative flux | Engineering practice, brackish RO |
| Operating pressure (NF/RO analog) | 1.0–1.8 MPa | PMC, 2023 |
| pH | 6.5–7.5 typical for RO feed | Engineering practice |
| Temperature | 15–30 °C (flux derate outside this band) | Engineering practice |
Sizing Workflow: Flow, Recovery, Flux, Membrane Area
Five equations take you from a daily production number to a bill of materials for the RO skid.
Step 1 — Establish design feed flow. Multiply daily starch production by the water-use ratio. A 30 t/d plant at 15 m³ water per ton of starch processed gives Q_feed = 30 × 15 = 450 m³/d, or about 18.75 m³/h on a continuous basis. Most plants will also need a peak factor of 1.2–1.5× for the wash-shift surge.
Step 2 — Choose recovery Y. For starch-laden feed after UF, 75–85% is the defensible band. The upper bound is anchored by the ~80% water recovery reported in the 2023 UF/NF pilot on potato processing water (PMC, 2023). Push beyond 85% only with proven pilot data on the actual UF permeate, because osmotic pressure on the concentrate rises sharply and flux collapses.
Step 3 — Compute permeate and concentrate flows. Q_p = Y · Q_feed and Q_c = (1 − Y) · Q_feed. At Y = 0.80 and Q_feed = 450 m³/d, Q_p = 360 m³/d and Q_c = 90 m³/d.
Step 4 — Select design flux J and compute membrane area. Use J = 15–25 L/m²·h (LMH) for starch-laden feed downstream of a working UF. The lower end is conservative and recommended for high-recovery operation; the upper end is reachable when the SDI is well controlled. Membrane area A = Q_p / J. At Q_p = 360 m³/d = 15,000 L/h and J = 20 LMH, A = 750 m². Translate to elements: at ~37 m² per 8-inch element, that is roughly 20 elements, or 2 vessels of 7 elements in a 2:1 array for an 80% recovery single-pass train.
Step 5 — Sanity-check against a vessel model. Standard 8-inch spiral-wound elements deliver 35–40 m² of active area and handle 0.3–0.5 MPa of pressure drop per vessel. For 80% recovery on a single-pass train, plan for 2:1 staging (two parallel vessels feeding one concentrate vessel); for higher recovery or tighter permeate quality, add a second pass with a booster pump.
Pilot data at 1.4×10⁻² m² flat-sheet area (PMC, 2023) is a flux and rejection check, not a full-scale design. Derate the pilot flux by 15–25% for temperature, fouling, and recovery losses before you commit to element count.
| Step | Equation | Worked value (30 t/d plant, 80% recovery) |
|---|---|---|
| Feed flow | Q_feed = production × water-use ratio | 450 m³/d |
| Recovery | Y (chosen) | 0.80 |
| Permeate flow | Q_p = Y · Q_feed | 360 m³/d |
| Concentrate flow | Q_c = (1 − Y) · Q_feed | 90 m³/d |
| Design flux | J (chosen, 15–25 LMH) | 20 LMH |
| Membrane area | A = Q_p / J | 750 m² |
| 8-inch elements | A / 37 m² | ~20 elements |
Pretreatment Chain: Protecting the RO Membrane
RO on potato starch wastewater fails in the field when pretreatment is undersized. The defensible train is coarse screening → flow equalization → pH/temperature conditioning → dissolved air flotation (DAF) or lamella for residual suspended starch → UF at 10 kDa cutoff (polysulfone) → cartridge filter → RO. The mechanical screening step at the head of the train removes rags, stones, and tuber peel; the rotary bar screen at this position protects the pumps and DAF from carryover damage. The DAF stage, sized as a dissolved air flotation unit, strips out the bulk of the suspended starch that the primary settlers missed; a polishing multi-media filter ahead of the UF protects the UF membranes from grit.
UF membrane selection matters: the 2023 pilot used 10 kDa polysulfone for starch and protein removal (PMC, 2023). The same source documents that potato proteins adsorb rapidly onto PES UF membrane surfaces and that fresh deionized water alone does not restore flux — alkaline plus enzymatic cleaning is mandatory. Operating the NF/RO analog at 1.0–1.8 MPa with a 150–300 Da NF stage produced roughly 80% water recovery in that work (PMC, 2023); a full UF→RO train will sit at the upper end of that pressure band because the RO membrane is denser than the NF analog. The UF permeate entering the RO should hit SDI < 3 under normal operation, and < 5 as a minimum when flux is derated accordingly.
Pumps, Energy, and Operating Pressure
The cited operating window for membrane treatment of potato processing water is 1.0–1.8 MPa (PMC, 2023); a brackish-water RO stage on the UF permeate will operate at the upper end, typically 1.2–1.6 MPa. Specific energy consumption for a single-pass RO can be estimated as SEC ≈ ΔP / (36 · Y), where ΔP is in kPa, Y is recovery as a fraction, and SEC is in kWh/m³ permeate. At ΔP = 1,500 kPa and Y = 0.80, SEC ≈ 1,500 / (36 × 0.80) ≈ 5.2 kWh/m³ permeate. That is a ballpark figure; real-world SEC depends on feed salinity, pump efficiency, and whether an energy recovery device is fitted on the concentrate stream.
Specify a multistage centrifugal pump in 316L stainless steel, sized for 110–120% of the design flow with a VFD for turndown during low-production shifts. Above 70 bar of feed pressure, fit an isobaric energy recovery device (ERD) on the concentrate line; at 80% recovery the concentrate still carries 70–80% of the pump's input energy, and an ERD typically pays back in 12–24 months on a 300+ m³/d plant.
Cleaning, Fouling Control, and Concentrate Disposal
Potato protein fouls PES and polyamide membranes quickly, and water flushing alone will not recover flux (PMC, 2023). Build a CIP plan into the operating budget from day one: permeate flush to displace feed, alkaline detergent at pH 11–12 and 35–40 °C, enzymatic cleaner for residual protein (neutral protease is the standard choice), then a final permeate rinse until the return pH matches the supply. CIP frequency on starch plant RO typically lands in the 1–4 week range; trigger CIP when normalized flux drops 10–15% below the clean-water baseline or when differential pressure rises 15% across the train.
Concentrate disposal is the second hard question. At 80% recovery, the concentrate stream is ~5× the feed salinity and contains concentrated organics that did not pass the UF. Three defensible options: (1) evaporation pond where land and climate permit, (2) further concentration with a second-pass RO, forward osmosis, or a mechanical vapor recompression crystallizer if zero liquid discharge is the target, or (3) co-treatment with the factory's main effluent stream after the biological step. Solids separated upstream — biological sludge or DAF float — can be dewatered with a plate-and-frame filter press and the CIP chemistry dosed via an automatic chemical dosing system for repeatability between shifts.
Design Checklist Before You Issue a Purchase Order
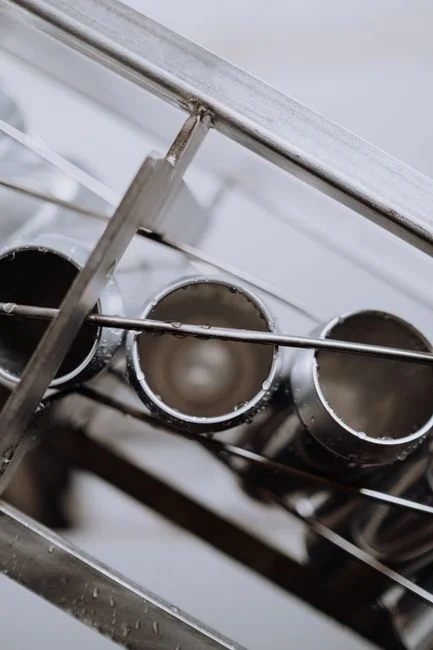
Before a purchase order leaves the desk, the design basis, equipment list, documentation deliverables, and vendor evaluation criteria should be locked. The table below is the minimum content of a one-page project execution summary that an engineer can hand to procurement. The complete RO skid at the heart of this train is typically procured as a packaged industrial RO system with a matched high-pressure pump and CIP loop. If the concentrate stream will be further treated, plan the piping and controls for it in the same P&ID — it is much cheaper to add a concentrate tie-in during skid fabrication than to retrofit it after startup.
| Category | Item | Acceptance criterion / value |
|---|---|---|
| Design basis | Feed flow (avg / peak) | 450 m³/d avg; 1.3× peak |
| Design basis | Target recovery | 75–85% (80% design point) |
| Design basis | Target permeate quality | Conductivity < 50 µS/cm; reuse in fluming |
| Equipment | Screening, equalization, DAF/lamella, UF, cartridge, RO, CIP, permeate tank, concentrate handling | Full train, matched hydraulically |
| Documentation | P&ID, mass balance, flux/recovery projection, CIP plan, concentrate disposal plan | Issued for review before PO |
| Vendor criteria | Membrane type (brackish polyamide), element area (~37 m²), pump efficiency with ERD, CIP automation level | Documented in bid tab |
Frequently Asked Questions
What is the typical recovery rate for RO on potato starch wastewater?
75–85% in industrial practice. The ~80% figure is anchored by the 2023 UF/NF pilot on potato processing water (PMC, 2023), which is the closest published analog to a full UF→RO train at industrial scale.
Can RO be used without UF upstream?
No. Potato starch and protein foul RO membranes within hours; the 2023 pilot data shows that protein adsorption onto PES surfaces is rapid and is not reversed by water flushing alone (PMC, 2023). A 10 kDa UF stage is the minimum pretreatment supported by the cited work.
What operating pressure does RO need for this feed?
1.0–1.8 MPa is the published operating window for NF on potato processing water (PMC, 2023); a brackish RO stage on the UF permeate will sit at the upper end, typically 1.2–1.6 MPa, depending on target recovery and feed conductivity.
How much nonstarch waste does a typical starch plant generate?
A 30 t/d plant produces roughly 14 t/d of nonstarch solids in its waste stream — protein, fiber, sugars, and ash that the process does not capture as saleable starch (per the Springer 1970 chapter on RO for potato-starch waste).
Why is fresh water ineffective for cleaning fouled RO membranes in this service?
Potato protein binds strongly to PES and polyamide membrane surfaces; chemical CIP with an alkaline detergent followed by an enzymatic cleaner is required to recover flux, as documented in the 2023 pilot study (PMC, 2023). For related reading on membrane reject handling and reuse configurations, see the RO reject reuse and discharge configuration guide, the article on sizing an MBR on UF reject, and the reference on sludge dewatering equipment selection.