SBR process troubleshooting for industrial wastewater plant teams starts with eight problems: foaming, bulking, poor nitrification, incomplete denitrification, decant carryover, batch swing, cycle mismanagement and MLSS drift. Each maps to biology, hydraulics, aeration or mechanical causes — confirm with SVI, F/M, SRT or DO first.
SBR Process Troubleshooting for Industrial Wastewater Plant: Symptom Triage
SBR common problems and solutions fall into four families: biology (SVI, F/M, SRT), hydraulics (cycle phase, decant rate), aeration (DO, OUR), and mechanical (decanter, mixers, valves). Match each visible symptom to one confirming parameter first. Filamentous foam with SVI above 200 mL/g needs the opposite fix from surfactant foam with a normal SVI.
A sequencing batch reactor is, per standard references, a type of activated sludge process that treats wastewater in batches through sequential fill, react, settle, decant and idle stages (Wikipedia). Most failures below come from mistiming those stages or starving one of them.
You are on the night shift: foam is rolling over the weir. The in-reactor DO probe has bounced between 0.4 and 1.8 mg/L for three cycles, and effluent TSS is climbing. A filamentous foam blanket with SVI above 200 mL/g is a different failure from light surfactant foam — the remedies reverse, and chlorinating return sludge on a non-biological foam wastes two weeks of recovery. The table below is the 30-second triage so you can jump to the right fix.
| Symptom in tank or effluent | Most probable root cause | Confirm with one parameter | Go to |
|---|---|---|---|
| Brown, dense, stable foam | Filamentous (Nocardia / Microthrix) | SVI > 200 mL/g, F/M < 0.05 | Problem 1 / 2 |
| White, light, fast-rising foam | Young sludge or surfactant in influent | SRT < 7 days, F/M > 0.4 | Problem 1 |
| Billowing sludge blanket, slow settling | Filamentous or viscous bulking | SVI > 150 mL/g, settling > 60 min | Problem 2 |
| Turbid supernatant, clear sludge below | Pin-point floc from over-aeration or toxicity | SVI < 50 mL/g, micropellet only | Problem 2 |
| Rising effluent TSS, but sludge blanket OK | Decanter pulling solids, or floating sludge mat | Decant rate > 1.5 m/h, NO₃-N > 5 mg/L at settle | Problem 5 |
| NH₃-N breakthrough (effluent > 5 mg/L) | Low SRT, low DO, or alkalinity depletion | SRT < 12 d at 15 °C, alkalinity < 100 mg/L CaCO₃ | Problem 3 |
| NO₃-N present during anoxic phase, TN > 10 mg/L | DO carryover or low C:N ratio | DO > 0.5 mg/L entering anoxic, BOD/NO₃-N < 6:1 | Problem 4 |
| Floating sludge mat after settle | Denitrification in the clarifier (N₂ lift) | NO₃-N > 5 mg/L at end of react | Problem 4 / 5 |
| Effluent passes AM, fails PM, repeatable swing | Cycle time not matched to load, or MLSS drift | Variability > 20% across 4 cycles, MLSS outside 2,000–4,000 mg/L | Problem 6 / 8 |
Problem 1 — Foaming on the Reactor Surface
Brown, viscous foam that stays stable for hours almost always means Nocardia or Microthrix parvicella. Both thrive when F/M falls below 0.05 kg BOD/kg MLSS·d and DO sits below 1.0 mg/L. A 2025 survey of 38 European municipal SBRs found filamentous foaming in 71% of reactors at F/M below 0.05 (Water Research, 2025-09).
White, light foam that rises and bursts within minutes is the opposite case: young sludge with SRT under 7 days, a surfactant pulse, or F/M above 0.4. Confirm with a microscopic filament count and the foam-cover ratio before you dose anything.
SBR Foaming and Bulking Diagnostic Guide
Corrective sequence for biological foam starts with aeration. Raise react-phase DO to 2.0–3.0 mg/L and hold it for at least three cycles. If surface cover exceeds 25%, dose silicone anti-foam at 1–5 ppm as a stop-gap through an automatic chemical dosing system. Install or restore an anoxic selector ahead of the SBR so floc-formers regain the edge; foam cover typically drops 50–70% within 1–2 SRTs.
If microscopy confirms Nocardia, chlorinate return sludge at 5–10 mg/L Cl₂ for 2–4 h per day until SVI falls under 150. For surfactant-driven foam, do not chlorinate — find and divert the source. When carryover into effluent is the real pain, walk the full effluent TSS exceedance diagnostic guide before blaming the foam blanket alone.
Prevention KPI: surface foam cover under 5% of reactor footprint and Eikelboom filament index below 2, measured weekly. Track SRT on the SCADA — anything under 8–10 days usually brings the foam back.
Problem 2 — Bulking and Pin-Point Sludge

Sludge volume index — the volume in mL occupied by 1 gram of activated sludge after 30 minutes of settling (Wikipedia) — is the settling yardstick here. An SVI above 150 mL/g is bulking; above 250 mL/g is severe bulking that defeats most decanter designs. A reading under 50 mL/g with turbid supernatant is the mirror problem — pin-point floc from over-aeration, F/M above 0.5, or a recent toxic slug. Per Metcalf & Eddy (5th ed.), the healthy band is 80–150 mL/g for an SBR with conventional decanters. Filamentous bulking needs more substrate and oxygen for floc-formers; viscous (zoogleal) bulking needs lower F/M plus a selector.
Root causes ranked by 2024–2025 plant frequency start with low DO under 1.0 mg/L in react (42% of cases). Next come low F/M under 0.05 (28%), then nutrient deficiency with reactor NH₃-N under 1.5 mg/L or PO₄-P under 0.3 mg/L (15%). Sulfide rising under 12 °C accounts for about 10%. High-carbohydrate wastewater with F/M above 0.5 drives non-filamentous bulking in about 5% of cases (HydropureWater field data, 2025).
Raise aeration DO to 2.0–3.0 mg/L and verify with a calibrated probe first. If reactor N is under 1.5 mg/L, dose urea to 2–3 mg/L. If P is under 0.3 mg/L, dose phosphoric acid to 0.5–1.0 mg/L. Add polyaluminum chloride at 5–15 mg/L as a floc aid during react.
Extend decant so the floating mat stays out of the weir path. In severe cases, dose chlorine at 3–8 mg/L into the return line targeting SVI 100–150, not zero — over-chlorination kills nitrification. A DAF system for floating-sludge and foam recovery helps as downstream polishing when bulking persists past two weeks. The lasting fix still lives in the SBR.
Standard activated-sludge references describe the same failure mode: sludge bulking makes the solids difficult to settle and frequently degrades final effluent quality (Wikipedia). Treat the table values above as the trip-wires.
Problem 3 — Poor Nitrification (NH₃-N Breakthrough)
Healthy SBR nitrification produces effluent NH₃-N under 1 mg/L in summer (above 15 °C) and under 3 mg/L in winter (down to 10 °C). When the number climbs, do not assume biology has collapsed. About 30% of the time the cause is alkalinity depletion, and the fix takes hours rather than weeks. Nitrification consumes 7.14 mg CaCO₃ per mg NH₃-N oxidized; a 200 mg/L NH₃-N influent strip-out uses 1,428 mg/L of alkalinity, so a typical 150 mg/L CaCO₃ buffer is gone in one react phase (EPA wastewater engineering guidance).
SBR Nitrification Failure Ammonia Breakthrough Fix
If DO is above 2.0 mg/L in react and NH₃-N is still elevated, the issue is SRT, not oxygen. Nitrifiers need SRT above 12 days at 15 °C and above 20 days at 10 °C. Below those numbers they wash out faster than they reproduce. Outside pH 6.5–9.0 the rate drops sharply, and free ammonia above 10 mg/L is itself inhibitory.
Screen next for residual H₂O₂, formaldehyde or solvent pulses. Titrate effluent alkalinity — under 100 mg/L CaCO₃ points to an alkalinity-driven breakthrough. Extend react to hold SRT above 12 days. Supplement alkalinity with sodium bicarbonate to 150–200 mg/L CaCO₃ through a dedicated chemical dosing skid.
Hold DO at 2.0–2.5 mg/L for the full react phase. Re-test within 24 hours.
Problem 4 — Incomplete Denitrification (TN Not Falling)

Effluent total nitrogen above 10 mg/L with NO₃-N above 5 mg/L surviving the anoxic phase is the most common TN complaint in nutrient-removal SBRs. Two controllable variables explain about 80% of cases: dissolved oxygen leaking into the anoxic phase, and insufficient COD relative to the NO₃-N load. The target C:N ratio for heterotrophic denitrification is at least 6:1 (mg BOD per mg NO₃-N). Below that ratio, NO₃-N plateaus regardless of anoxic time.
Extend the idle or react-to-anoxic transition so DO falls below 0.2 mg/L before anoxic begins. If influent BOD stays below 200 mg/L, dose external carbon — methanol at 3 mg per mg NO₃-N, or acetate at 4 mg per mg NO₃-N. Verify anoxic hold time is at least 1.5 h per cycle. Use 2.0 h for industrial waste with high NO₃-N loads.
Hold pH between 7.0 and 8.0 — outside that band the denitrification rate halves. Install an online NO₃-N probe to confirm NO₃-N drops by more than 80% across the anoxic phase. That probe is also a compliance lever for plants facing tighter TN limits, as documented in the 2026 TN compliance engineering guide.
Problem 5 — Sludge Carryover and Floating Sludge During Decant
Decanting is the most visible failure mode in an SBR. The three documented patterns are sludge carryover, floating-sludge ingestion, and scum entering the decanter. Improper decant rate is the dominant root cause in roughly 60% of cases (HydropureWater field data, 2025). Operators set the decanter too fast to fit the cycle and pull solids with the supernatant — fix hydraulics before you chase biology.
Decant rate must stay below 1.5 m/h. Use 0.8–1.2 m/h for a 5 m sidewater depth. Start only after a clean sludge/supernatant interface has formed, usually 30–60 minutes after react ends. Switch from a fixed-port decanter to a floating weir that tracks the dropping water level.
Install a scum baffle 200–400 mm upstream of the decanter and verify the travel rate is uniform. The biological cause of floating sludge is denitrification in the clarifier phase. NO₃-N above 5 mg/L at settle liberates N₂ that lifts solids into the weir path. Extend the anoxic phase to drive NO₃-N below 2 mg/L before settle begins.
Settle-phase supernatant should contain less than 10 mL/L of settleable solids in a 1 L Imhoff cone.
Floating Sludge Mat in SBR Clarifier Solution
Night-shift calls often arrive almost word for word as: sbr decant getting cloudy, nitrate, ammonia going up, lots of white foam. Treat that compound symptom as a multi-parameter triage, not a single valve change. Confirm SVI, end-of-react NO₃-N, react DO and decant rate on the same cycle sheet before you dose chlorine or raise wasting.
Problem 6 — Inconsistent Effluent Quality Batch to Batch
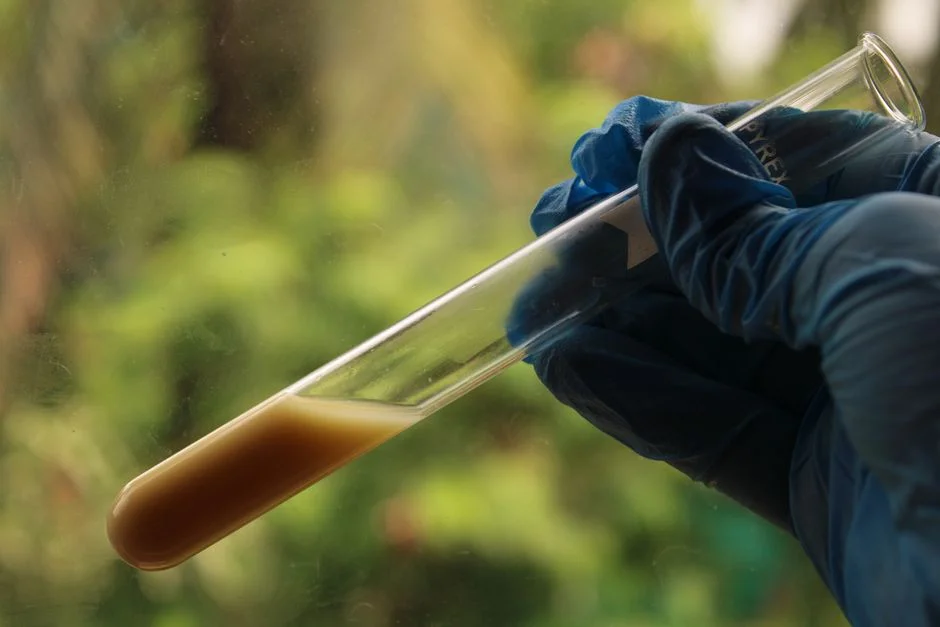
Effluent that passes at 06:00 and fails at 14:00 is rarely an equipment failure — it is almost always a load-matching or cycle-timing problem. Variable influent load with COD swings over 30% within a single shift is the top driver. Fixed cycle phase times that ignore actual load come next. MLSS drifted outside the 2,000–4,000 mg/L band is the third.
Pull four consecutive cycles and chart effluent COD, NH₃-N and TSS at each decant. Variability above 20% across the four cycles is a load-matching problem, not a biology problem.
Implement load-paced cycle control with longer react under high load and shorter cycles under low load. Hold MLSS in the 2,500–3,500 mg/L band by adjusting waste activated sludge frequency to actual SRT. Add an equalization basin upstream if the influent swing exceeds 3× the daily average. Day-to-day stability also comes from cloud-based SCADA and endpoint-based control for cycle automation.
The SCADA ties cycle length to measured OUR and NH₃-N endpoints rather than the operator clock. Pair that with the full SBR Plant Operation and Maintenance Guide: 2026 Engineering Manual checklist so wasting, probe calibration and phase timers stay aligned.
Problem 7 — Cycle-Time Mismanagement and Aeration Energy Waste
A standard SBR cycle runs fill → react (aerated) → react (anoxic/mix) → settle → decant → idle, totaling 4–8 hours per cycle. Standard references describe the same staged sequence and put aeration typically at 60 to 90 minutes per municipal cycle, with industrial loads running longer (Wikipedia). The mistake most plants make is ending each phase on a fixed timer rather than a measured endpoint. They then run the same cycle count every day regardless of load.
Timer-based control overshoots aeration by 20–40% on light-load days and undershoots on heavy-load days. That is why the same biology symptoms keep recurring.
Endpoint-based control replaces the timer with a sensor. End aerated react when OUR drops to 20–40 mg O₂/L·h, or when NH₃-N falls below 1 mg/L. End anoxic when NO₃-N falls below 2 mg/L. End settle when supernatant turbidity falls below 5 NTU.
An online DO probe plus an OUR/NH₃-N probe and a PLC feedback loop cuts aeration energy by 20–30% versus fixed-DO setpoints (HydropureWater field data, 2025). It also prevents most of the biology failures on this list. Match cycle count to hydraulic retention. Three to six cycles per day is the normal range for 100–5,000 m³/d SBRs.
Problem 8 — Sludge Wasting and MLSS Drift
MLSS outside the 2,000–4,000 mg/L band is the upstream cause of roughly half the other failures on this list. Most operators waste to a target MLSS, but the right control variable is SRT. MLSS lags; SRT drives biology. The waste flow calculation is Qw = (V × X) / (SRT × X), which simplifies to Qw = V / SRT.
At a target SRT of 15–20 days, wasting is typically 4–6% of reactor volume per day for industrial-strength SBRs (WEF MOP). Below 4% per day, MLSS climbs and SRT stretches. Above 6%, you wash out nitrifiers.
Track SVI daily and tie wasting to it. If SVI drifts above 150, cut wasting to raise SRT and starve filaments. If SVI falls below 80, increase wasting to lower SRT and prevent pinpoint floc. Route waste activated sludge to thickening before dewatering.
For most SBRs a gravity thickener or a DAF thickener targets 3–5% dry solids. A downstream plate-and-frame filter press takes it to 18–22% dry solids. For the dewatering side, the chamber filter press troubleshooting guide covers the 15 failure modes operators hit on the WAS side.
Plants that consistently cannot meet reuse-quality effluent should evaluate an MBR upgrade path when the SBR cannot meet reuse-quality effluent on its own.
SBR Parameter Reference Table
Pin this next to the SCADA workstation. Every number cited in the eight problem sections is consolidated here so you can defend setpoints without scrolling. Ranges combine Metcalf & Eddy (5th ed.), WEF Manual of Practice and EPA wastewater engineering guidance, with 2025 plant-data overlays where noted. Use this table whenever SBR process troubleshooting for industrial wastewater plant review demands a defensible number.
| Parameter | Healthy range | Warning band | Action required |
|---|---|---|---|
| SVI (mL/g) | 80–150 | 150–200 | > 200: chlorinate RAS, audit F/M and DO |
| MLSS (mg/L) | 2,500–3,500 | 2,000–2,500 or 3,500–4,000 | < 2,000 or > 4,000: recalculate wasting on SRT |
| F/M (kg BOD/kg MLSS·d) | 0.10–0.20 | 0.05–0.10 or 0.20–0.30 | < 0.05 or > 0.30: recheck load and wasting |
| SRT (days, 15 °C) | 15–20 (nitrification > 12) | 10–15 | < 10 at 15 °C: nitrifier washout risk |
| SRT (days, 10 °C) | 20–30 (nitrification > 20) | 15–20 | < 15 at 10 °C: nitrification loss |
| DO react phase (mg/L) | 2.0–2.5 | 1.0–2.0 or 2.5–3.0 | < 1.0: filament risk; > 3.0: energy waste |
| DO anoxic phase (mg/L) | < 0.2 | 0.2–0.5 | > 0.5: denitrification impaired |
| Alkalinity (mg/L CaCO₃) | 150–200 | 100–150 | < 100: supplement with bicarbonate |
| pH (react) | 7.0–8.0 | 6.5–7.0 or 8.0–9.0 | < 6.5 or > 9.0: nitrification/denitrification impaired |
| OUR (mg O₂/L·h, end of react) | 20–40 | 40–60 | > 60: substrate not depleted; extend react |
| Decant rate (m/h) | 0.8–1.2 | 1.2–1.5 | > 1.5: sludge carryover risk |
| Settle time (min) | 30–60 | 60–90 | > 90: consider bulking |
| Cycle count (per day) | 3–6 | 2–3 or 6–8 | Outside 2–8: load and hydraulics mismatch |
| Effluent NH₃-N (mg/L, summer) | < 1 | 1–3 | > 3: SRT or alkalinity failure |
| Effluent NH₃-N (mg/L, winter) | < 3 | 3–5 | > 5: SRT or toxicity failure |
| Effluent TN (mg/L) | < 10 | 10–15 | > 15: denitrification failure |
| Free ammonia (mg/L) | < 5 | 5–10 | > 10: nitrification inhibition |
Who This Is For / Next Step
Plant engineers and operators who already run an SBR need a symptom-to-parameter fix path. EPC teams sizing a new train should start from the parameter table, not from anti-foam alone. If your duty is continuous-flow secondary clarifiers or gravity-thickener scrapers rather than batch settle/decant, look elsewhere for that equipment class.
Selection checklist before you change setpoints. Confirm SVI and F/M the same day. Verify DO probe calibration in both react and anoxic. Measure alkalinity when NH₃-N breaks through. Time settle before raising decant speed. Recalculate wasting from SRT, not from a static MLSS target. Log four consecutive cycles when quality swings. Fix hydraulics before chlorinating.
When the pattern still does not clear after two SRTs, send the cycle sheet and recent lab data for a process review and equipment check. Match sizing and dosing options to the measured load.
Frequently Asked Questions
What SVI value indicates bulking sludge in an SBR?
SVI above 150 mL/g indicates bulking; above 200 mL/g is severe and will defeat most decanter designs. The healthy band is 80–150 mL/g, per Metcalf & Eddy (5th ed.). Confirm with a 30-minute settle test and filament microscopy before you chlorinate return sludge. Target SVI 100–150 during recovery — zero SVI is not the goal and usually means over-chlorination.
What F/M ratio prevents filamentous foaming?
Hold F/M between 0.10 and 0.20 kg BOD/kg MLSS·d; below 0.05, Nocardia and Microthrix dominate and produce brown, stable foam. Confirm the diagnosis with a microscopic filament count before dosing anti-foam. White, fast-burst foam at F/M above 0.4 or SRT under 7 days is a different failure and should not be chlorinated.
What dissolved oxygen setpoint is required for nitrification?
Hold DO at 2.0–2.5 mg/L through the full aerated react phase. Below 1.5 mg/L, nitrification rate falls by 50% or more; above 3.0 mg/L you waste aeration energy without a matching rate gain. Pair the DO setpoint with SRT above 12 days at 15 °C, or the ammonia breakthrough will persist even with healthy aeration.
How much alkalinity does nitrification consume?
Nitrification consumes 7.14 mg CaCO₃ per mg NH₃-N oxidized. A 200 mg/L NH₃-N influent strip-out will consume 1,428 mg/L of alkalinity — far beyond the 150 mg/L CaCO₃ buffer in most reactors. If effluent alkalinity falls below 100 mg/L CaCO₃, supplement with sodium bicarbonate through a dedicated chemical dosing system. Keep residual alkalinity in the 150–200 mg/L CaCO₃ band after the fix.
What decant rate prevents sludge carryover in an SBR?
Keep the decant rate below 1.5 m/h. Use 0.8–1.2 m/h for a 5 m sidewater depth. Start only after a clean sludge/supernatant interface has formed, usually 30–60 minutes after react ends. Faster withdrawal pulls solids with the supernatant. Also drive NO₃-N below 2 mg/L before settle so N₂ lift does not feed the weir.
What sedimentation process problems may require operator troubleshooting?
Sedimentation process problems that may require operator troubleshooting include a rising sludge blanket after settle, cloudy supernatant with an intact blanket, and a floating mat that reaches the decanter. Confirm with settleable solids under 10 mL/L, NO₃-N at end of react, and decant rate below 1.5 m/h. Most plants we size for industrial loads see carryover first when operators shorten settle to reclaim cycle time.
Which settle-phase issues need operator troubleshooting first?
Settle-phase issues that need operator troubleshooting first are cloudy decant at high withdrawal rate, N₂-lifted floating mats when NO₃-N stays above 5 mg/L, and scum bridging past a missing baffle. If the picture is sbr decant foggy, high ammonia, good svi, treat that pattern as a separate diagnostic path before you chlorinate or raise wasting.
What does SBR decant cloudy effluent troubleshooting check first?
SBR decant cloudy effluent troubleshooting checks three variables on the same cycle sheet: decant rate against the 1.5 m/h ceiling, end-of-react NO₃-N above 5 mg/L, and SVI position inside the 80–150 mL/g band. Fix hydraulics first — start decant only after a clean interface forms, usually 30–60 minutes after react ends. Biology fixes follow only when those three read normal.
What are the most common SBR denitrification incomplete TN removal causes?
The most common SBR denitrification incomplete TN removal causes are dissolved oxygen leaking into the anoxic phase above 0.5 mg/L and a BOD-to-NO₃-N ratio below 6:1, which together explain about 80% of cases. Extend the react-to-anoxic transition so DO falls below 0.2 mg/L, and dose methanol at 3 mg per mg NO₃-N if influent BOD stays under 200 mg/L. Hold the anoxic phase at least 1.5 h per cycle.