Why Plastic Manufacturing Sludge Is a Different Problem
Plastic-plant sludge is not generic industrial sludge — it is a chemical reservoir. Three distinct fractions co-mingle in the same thickening or dewatering train: (1) suspended polymer fines from reactor washing, extrusion cooling, and pellet-handling spills (typically PE, PP, PET, PVC); (2) waste activated sludge from biological BOD/COD reduction; and (3) chemical precipitates carrying emulsified extrusion oils, stabilizers, and sorbed plasticizers. Published MP mass-balance work found 98.1% removal in the liquid train but 73.8% of microplastics accumulated in the sludge (per Top 4, Environmental Science & Technology), and phthalate/BPA occurrence in wastewater is documented at ng/L–µg/L across the plasticizer class (per Top 5, Springer 2024). The sludge — not the effluent — is where these contaminants concentrate.
That partitioning drives the compliance picture. Residual monomers (styrene, vinyl chloride, BPA) and high-molecular-weight phthalate plasticizers (DEHP, DBP, BBP, DINP) sorb onto biomass and ferric floc, and re-dissolve under mildly acidic or surfactant-rich conditions. In the Toxicity Characteristic Leaching Procedure (TCLP, EPA Method 1311, SW-846 40 CFR 261) the cake is extracted at pH 2.88–4.93, which is exactly the window in which sorbed phthalates and residual VCM desorb. A cake that passes a paint-filter or total-solids test can still fail TCLP and force classification as hazardous waste — a different disposal cost bracket entirely. The 2026 design question is no longer "can the press hit 30% DS?" but "will the cake pass TCLP, and what does the microplastic mass balance look like on the way to disposal?"
Influent Characterization: What the Engineer Must Measure First
The data that drives sludge-handling design is not the same data on the monthly DMR. For polymer/PET/PVC plants, the engineer should pull the following before specifying equipment:
- Liquid-phase parameters: total suspended solids 200–2,500 mg/L (driven by polymer fines from washing and pellet-handling); COD 800–6,000 mg/L; oil & grease 50–600 mg/L when extrusion oils are present; specific plasticizer screening (DEHP, DBP, BBP, BPA) by GC-MS or LC-MS/MS at ng/L detection limits.
- Biological-stage parameters (if present): MLSS 3,000–6,000 mg/L; SVI 80–150 mL/g for plastic-plant biomass (often lower than municipal due to small, dense floc); waste activated sludge dry-solids 0.6–1.2%.
- Microplastic baseline: a published municipal benchmark of 4.40 ± 0.14 particles/g dry sludge pre-digestion versus 0.31 ± 0.01 particles/g post-digestion (per Top 4) is a useful reference for designing the digestion-stage mass balance, even when the absolute loading is site-specific.
- Coagulant demand: jar tests with the actual feed to fix FeCl3, alum, or PACl dose — published marble-processing data put the working range at 200–500 ppm for the cutting/equalization streams (Top 1, 2006).
Skip this work and the dewatering spec is guesswork. Polymer demand, cake dryness, and TCLP outcome all derive from the upstream chemistry, not from the press datasheet.
The 2026 Process Train: Equalization to Cake Disposal

The full sludge-bearing train for a plastic/PET/PVC plant runs in seven steps. Map these to your P&ID and the design gaps usually appear immediately.
- Flow and load equalization. 6–12 hour HRT basin with coarse-bubble aeration to homogenize batch discharges from polymerization, washing, and cleaning. A 10 m³/d stream from a 50,000 t/yr PET line typically needs 25–50 m³ of equalization to smooth pH (often 4–9 swings) and temperature spikes.
- Primary clarification or DAF. Use a DAF unit for primary polymer-fine and oil removal when emulsified oils or floating polymer particles dominate. Coagulant dose sits in the 200–500 ppm range for FeCl3 or Al2(SO4)3 (Top 1), with 1–5 ppm cationic flocculant. DAF typically achieves 80–95% TSS and 70–90% oil removal here, against 50–70% TSS for a primary clarifier.
- Biological treatment. Conventional activated sludge or MBR at HRT 8–24 h. MBR retains slow-growing biomass that can partially degrade long-chain phthalates; it also produces a lower-SVI waste sludge, which is helpful at the press.
- Sludge thickening. Gravity thickener to 2–4% DS, or DAF thickening to 3–5% DS. Polymer dose at this step is typically 2–5 kg/t DS.
- Sludge conditioning. Cationic polyacrylamide (CPAM, charge density 30–60%, MW 8–12 MDa) at 2–8 kg/t DS. Use FeCl3 + lime instead when the cake must pass TCLP for metals or where plasticizer load is high enough that CPAM alone cannot suppress leaching. An automatic polymer and coagulant dosing skid is worth specifying — dose drift is the single largest cause of press cycle variability.
- Mechanical dewatering. Filter press (25–35% DS), decanter centrifuge (20–28% DS), or screw press (18–25% DS) — selected per the framework in the next section.
- Cake disposal. Landfill (non-hazardous), hazardous-waste incineration, or land application only after confirmatory TCLP and microplastic screening on the cake itself.
The press or centrifuge is the most expensive line item, but the upstream chemistry (Steps 2 and 5) decides whether the cake is even legally disposable at the end.
Mechanical Dewatering Equipment: Filter Press vs Centrifuge vs Screw Press
For plasticizer- and microplastic-laden sludge, the equipment choice is a five-axis decision: achievable cake dryness, polymer demand, CAPEX, OPEX, and sensitivity to plasticizer/oil content in the feed. The comparison below is built for a 1–30 m³/h feed stream at 2–4% DS (per HydropureWater field data, 2026).
| Parameter | Plate-and-frame filter press | Decanter centrifuge | Screw press |
|---|---|---|---|
| Cake dry solids (DS) | 25–35% | 20–28% | 18–25% |
| CPAM polymer demand | 2–5 kg/t DS | 4–8 kg/t DS | 1–3 kg/t DS |
| CAPEX (1–30 m³/h) | $80K–$350K | $150K–$500K | $40K–$120K |
| OPEX (energy + polymer) | 5–15 kWh/t DS; low wear | 30–60 kWh/t DS; high wear on scroll from polymer fines | 10–20 kWh/t DS; low wear but sensitive to tramp material |
| Operation mode | Batch (1–4 cycles/h) | Continuous | Continuous |
| Plasticizer / oil tolerance | High — cake can be washed in the press if needed | Low — oil slugs upset scroll balance | Very low — slugs cause slip and bypass |
| Best fit | Plasticizer-laden, hazardous-classification-risk cake | Large biological-only streams with stable feed | Small, low-contamination plants |
For the typical polymer-plant stream — biological sludge combined with DAF float and chemical precipitate, carrying residual phthalates and monomer — the plate-and-frame filter press for plasticizer-laden sludge is the conservative 2026 default. It gives the driest cake (lowest disposal tonnage), tolerates oil and plasticizer variability, and supports in-press cake washing to lower leachable contaminant load before TCLP. Centrifuges win on continuous throughput and footprint where the biological fraction dominates and the feed is well-equalized. Screw presses fit small plants below ~5 m³/d where CAPEX is binding and the feed is already low in free oil. For installation details and commissioning checks, walk through the Filter Press Installation and Commissioning: 2026 Engineering Field Guide.
Microplastics and Plasticizers in the Cake: The 2026 Compliance Reality
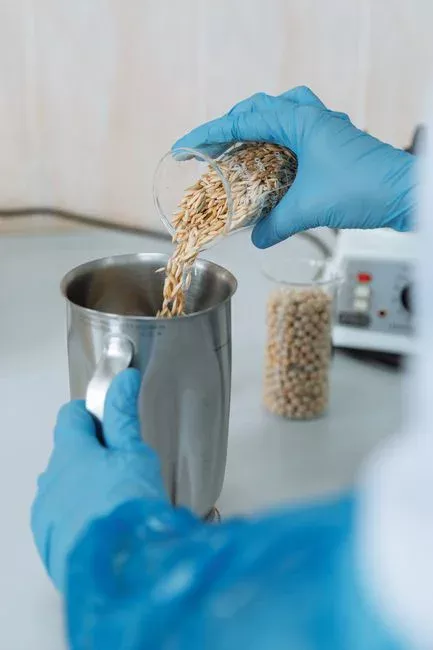
The compliance question has moved from effluent to cake. Liquid-train MP removal of 98.1% sounds excellent until you account for the 73.8% of microplastics that partition into the sludge (per Top 4) — the disposal stream now carries nearly three-quarters of the influent MP mass. For a PET/PP/PVC plant, the cake microplastic load is dominated by PET, PP, and PE fragments (per FT-IR analysis in the same study), and the same is true for plasticizer load: phthalates and BPA concentrate on biomass rather than staying in the clarified water.
Two operational levers in 2026:
- Anaerobic digestion as a pre-dewatering polishing step. Mesophilic digestion at 35–37°C, 15–20 day SRT, has been shown to reduce MPs in sludge by roughly 10× — from 4.40 to 0.31 particles/g dry in the cited dataset (per Top 4). Where digester capacity already exists, this is the cheapest available MP-mitigation step.
- Plasticizer compliance via TCLP-equivalent screening. REACH SVHC listings for DEHP, DBP, BBP, and several BPA analogues are forcing EU and several Asian jurisdictions to apply leaching tests to cake, not just feed. Thresholds vary by jurisdiction and update annually — confirm against the current ECHA Candidate List and your local hazardous-waste regulator before finalizing the disposal route. A cake that fails TCLP at pH 4.93 cannot go to a non-hazardous landfill regardless of its total solids.
For biological sludge streams with high organic load, also evaluate the SBR for Pet Food Wastewater: 2026 Engineering Design & Process Guide — the SBR mass-balance logic carries over to the sequencing of aeration/anoxic phases for partial plasticizer breakdown.
Cost, Polymer Consumption, and Cake Disposal Economics
Polymer is the largest single OPEX line. At 4 kg CPAM/t DS and $3.50–$6.00/kg (per HydropureWater field data, 2026), a 10 m³/d sludge stream at 2% DS — i.e. about 0.2 t DS/d — runs $10K–$25K/year in polymer alone. That is typically larger than the press energy bill, which is why the comparison table above puts polymer demand on the same axis as cake dryness: a drier cake is less tonnage to dispose of, but it costs more in conditioning chemistry to reach.
Cake disposal brackets the operating picture: non-hazardous landfill at roughly $40–$80/ton; hazardous landfill or incineration at $120–$300/ton if plasticizer or residual-monomer leaching pushes the cake above the regulatory threshold. Halving cake moisture from 75% to 65% cuts hauled tonnage by ~30%, which often justifies the higher filter-press CAPEX on disposal-cost savings alone. Energy trades off against polymer: filter press 5–15 kWh/t DS versus decanter 30–60 kWh/t DS — centrifuges burn more power but typically use less polymer, and the optimal mix is site-specific.
Frequently Asked Questions
What cake dryness should we target for plasticizer-laden polymer-plant sludge? 25–35% DS via a plate-and-frame filter press for plasticizer-laden sludge — dry enough to minimize disposal tonnage, tolerant of the polymer-fine and oil variability that would upset a centrifuge.
How much cationic polyacrylamide does the sludge need? Typical 2–8 kg CPAM/t DS, with 2–5 kg/t DS for a filter press and 4–8 kg/t DS for a decanter; jar-test the actual feed to fix the dose.
Where do most microplastics end up — effluent or sludge? Sludge. About 73.8% of microplastics accumulate in the sludge stream despite 98.1% liquid-train removal (per Top 4), so the disposal mass balance lives in the cake, not the effluent.
Does anaerobic digestion actually reduce microplastics in the cake? Yes — mesophilic digestion at 35–37°C with 15–20 day SRT has been shown to cut MP load in sludge by roughly 10× (from 4.40 to 0.31 particles/g dry, per Top 4).
What decides whether the cake is hazardous? TCLP leaching at pH 2.88–4.93 (EPA Method 1311), driven primarily by desorbable phthalate plasticizers, residual VCM/styrene, and any heavy metals co-precipitated by FeCl3 dosing. Confirm thresholds against the current ECHA SVHC list and your local hazardous-waste rules before specifying the disposal route.