
MBBR Troubleshooting: Mapping Symptoms to Fixes
MBBR troubleshooting follows a symptom-led diagnostic. Media washout points to cracked sieves or hydraulic overload above 3.0 m³/m²·h. Biofilm loss indicates F/M shock or DO collapse below 2 mg/L. Nitrification failure typically signals pH below 6.5 or temperature below 10°C. Correct identification against those thresholds restores performance within 24-72 hours.
The moving bed biofilm reactor is mechanically simple but biologically sensitive — once you can map a symptom to a mechanism, the fix is almost always procedural. The article ahead is built as a numbered fault register. Each fault follows the same rhythm: symptom signature → likely causes ranked → on-site diagnostic steps with numeric thresholds → corrective action → prevention. A consolidated reference table sits in the middle as a quick-reference card for the control room.
Why MBBRs Fail: The Three Root Mechanisms Behind 90% of Plant Issues
Biofilm carrier media in modern MBBRs is HDPE with a protected surface area of 500-800 m²/m³. That surface holds heterotrophs, nitrifiers, and denitrifiers in stratified layers. Unlike activated sludge, the moving bed biofilm reactor has no sludge recycle loop. Biomass stability depends entirely on retained carriers, hydraulic residence, and influent consistency. That is what makes the process robust under steady loading and fragile under shock.
Three root failure modes account for the vast majority of plant issues:
- Biomass loss — washout through damaged sieves, biofilm detachment from toxicity or hydraulic surge, carrier attrition.
- Biomass imbalance — F/M shock, pH or temperature excursion outside the nitrification band, dissolved oxygen collapse.
- Physical failure — sieve or aerator damage, airlift pump failure, coarse screening bypass upstream.
HDPE carrier attrition stays under 2% per year per the AnoxKaldnes 2024 technical bulletin. The media itself is rarely the failure cause. If you are losing carriers, the sieve is guilty until proven otherwise. For lifecycle cost context on parts and service spend, see the MBBR maintenance cost in 2026 breakdown. That breakdown shows sieves and aerator diffusers drive 60-70% of annual spare-parts OPEX.
Fault #1: Media Washout Through Sieves and Outlet Weirs
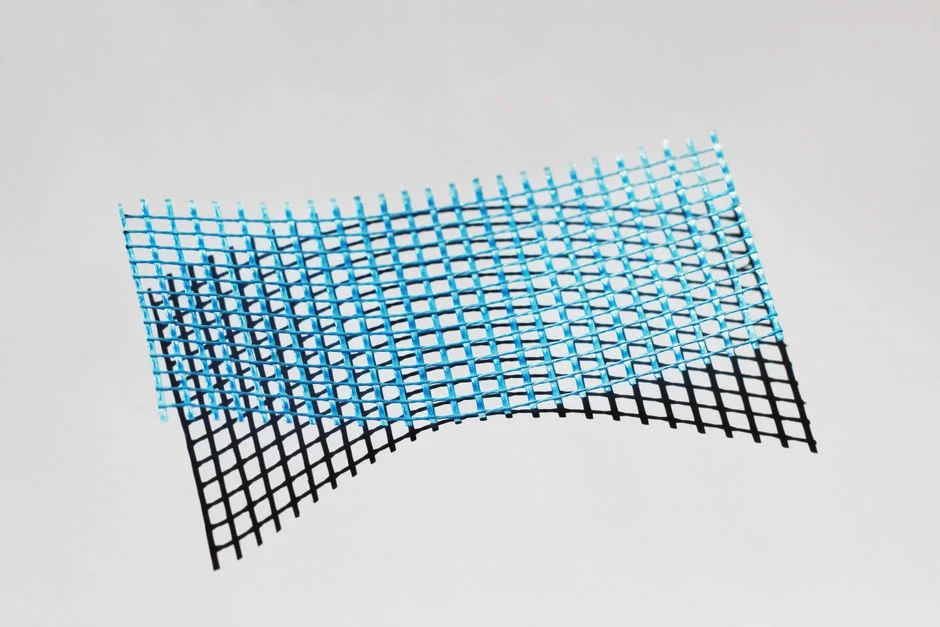
Carriers visible in the downstream clarifier or DAF unit are the #1 MBBR fault call. The signature is unmistakable: a sudden drop in attached MLVSS, effluent turbidity rising 20-50 NTU, and small plastic cylinders floating in the scum trough. Most plants we size for keep peak sieve loading near 2.0-2.5 m³/m²·h so a cracked panel shows up before a full media dump.
Diagnostic steps (5-step rhythm):
- Symptom signature: carriers downstream, attached MLVSS drop, turbidity +20-50 NTU.
- Causes ranked: damaged sieve (60% of cases), hydraulic overload during peak flow (25%), undersized outlet (10%), carrier attrition (5%).
- On-site diagnostic: inspect perforated plate or cylindrical sieve for cracks, measure actual hydraulic loading against the design band of 1.5-3.0 m³/m²·h, check airlift pump velocity if carriers are circulating beyond the screen.
- Corrective action: replace the sieve panel, install a back-up wedge-wire screen with 5-7 mm slot, add flow equalization upstream to cap peak HLR at 2.5 m³/m²·h.
- Prevention: Run monthly sieve inspection and an annual flow audit. Install a carrier-loss sensor with an alarm threshold at 5 carriers per m³ of effluent. Pre-screening with a rotary mechanical bar screen at 3-5 mm aperture reduces sieve-loading debris.
Fault #2: Biofilm Loss and Carrier Surface Stripping
Carriers that were deep brown last week turn pale tan or white. COD removal drops 20-40% within 48 hours. A microscopic exam of scraped biofilm shows thin or absent coverage. The attached growth treatment biology has been compromised.
Diagnostic steps:
- Symptom signature: pale carriers, COD removal -20-40%, thin or absent biofilm under microscope.
- Causes ranked: toxic slug (40%), F/M shock (30%), sudden temperature drop >5°C in 24 hours (20%), hydraulic surge (10%).
- On-site diagnostic: (1) check influent for toxins — chlorides above 5,000 mg/L for domestic biomass, solvents, heavy metals (Cr, Cu, Ni). (2) Review F/M against the 0.2-0.5 lb BOD/lb MLVSS-day band — below 0.1 starves biofilm; above 0.8 causes sloughing. (3) Measure the DO profile across reactor length. (4) Check for a temperature drop >5°C within 24 hours.
- Corrective action: isolate the toxic source, stop feed, hold aeration at DO 4-6 mg/L for 12-24 hours to re-seed biofilm from residual carriers, then ramp influent over 48-72 hours. Detachment triggers include toxic slug (cyanide >0.5 mg/L, free chlorine >0.05 mg/L), hydraulic surge, and sudden pH swing >2 units.
- Prevention: install influent toxicity alarm, log F/M daily, gradual temperature acclimation.
Visible biofilm recovery takes 5-10 days. Full nitrification recovery takes 14-21 days at 20°C. Plan resampling accordingly.
Fault #3: Nitrification Failure — When NH3-N Spikes Above Permit
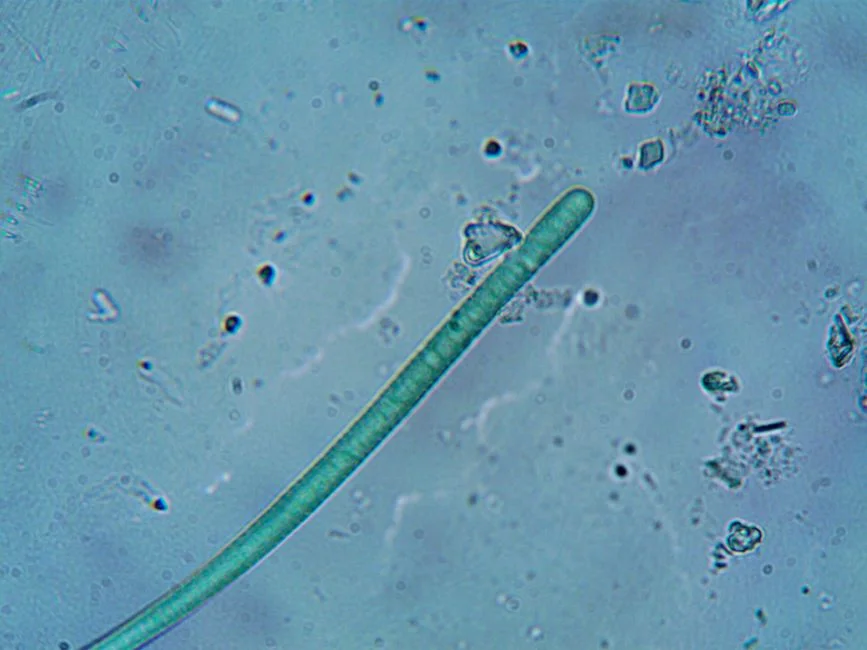
Effluent NH3-N rises from under 2 mg/L to above 10 mg/L. NO2-N accumulates to 5-15 mg/L as partial nitrification takes hold. Alkalinity drops below 80 mg/L as CaCO3 as the system consumes buffer. This failure triggers compliance pressure under the 2024 EPA nutrient criteria update for seasonal NH3-N limits in sensitive watersheds. China GB 18918-2002 amended in 2025 Class 1A discharge faces the same NH3 risk. EU plants face parallel pressure under UWWTD 2024/3019 implementation timelines.
Diagnostic steps:
- Symptom signature: effluent NH3-N >10 mg/L, NO2-N 5-15 mg/L, alkalinity <80 mg/L as CaCO3.
- Causes ranked: low DO in the nitrification zone (45%), temperature <10°C (25%), pH <6.5 (15%), toxic inhibition (10%), insufficient media fill below 30% (5%).
- On-site diagnostic: Profile DO across reactor length; target 4-6 mg/L in the nitrification zone. Measure pH (target 7.0-8.2) and confirm temperature >12°C for full nitrification. Confirm alkalinity >100 mg/L as CaCO3 and HRT minimum 6 hours at 15°C. Verify media fill with a known-volume grab sample — 40-67% is typical, with 50% the design sweet spot for most municipal loads.
- Corrective action: For cold-weather mitigation, increase media fill to 50-60% to offset the slower growth rate. Reduce BOD loading to keep F/M below 0.3 and add supplemental aeration to hold DO 5+ mg/L. For re-start after cold shock, seed with 10-20% returned sludge from the secondary clarifier for 7 days, then return to pure attached growth. For pH excursions, deploy automatic chemical dosing for pH correction tied to a 4-20 mA probe signal.
- Prevention: continuous DO and pH monitoring with alarms, seasonal media-fill audit, alkalinity trim dosing before winter. For a 2026-specific compliance frame, see the 2026 global pH and nutrient discharge compliance guide.
Fault #4: Foaming, Bulking Sludge Carryover and Clogged Carriers
Stable brown foam 200-400 mm thick sits on the reactor surface. Sloughed biofilm chunks pass into the downstream clarifier. Media fill effective volume falls 15-30% because carriers are visibly caked with growth. Food and dairy plants we support usually see surfactant spikes before filamentous foam locks in.
Diagnostic steps:
- Symptom signature: brown foam 200-400 mm, sloughed chunks downstream, caked carriers.
- Causes ranked: surfactant or oil ingress (40%), filamentous overgrowth in warm temperatures (30%), sustained F/M >0.8 (20%), calcium phosphate precipitation (10%).
- On-site diagnostic: inspect foam for filaments under microscope (Nocardia-type), sample carrier biofilm thickness, check phosphorus in influent, measure DO in dead zones.
- Corrective action: install a surface skimmer, dose antifoam (silicone 0.5-2 mg/L intermittent) — use automatic chemical dosing for antifoam control tied to a foam-height sensor. Reduce HRT if it is below 4 hours to wash out filaments. For caked media, trigger controlled sloughing with a brief high-DO spike at 6-8 mg/L for 4-6 hours. A targeted chlorine dose of 2-5 mg/L for 30 minutes also works. Never use continuous chlorination; it kills all biomass and forces a full re-seed. For high-FOG food and dairy streams, an IFAS operating cost comparison can clarify whether moving to integrated fixed-film activated sludge beats MBBR for your load profile.
- Prevention: equalize surfactant loads, maintain F/M inside the 0.2-0.5 band, weekly carrier inspection.
MBBR Operating Parameter Reference Table
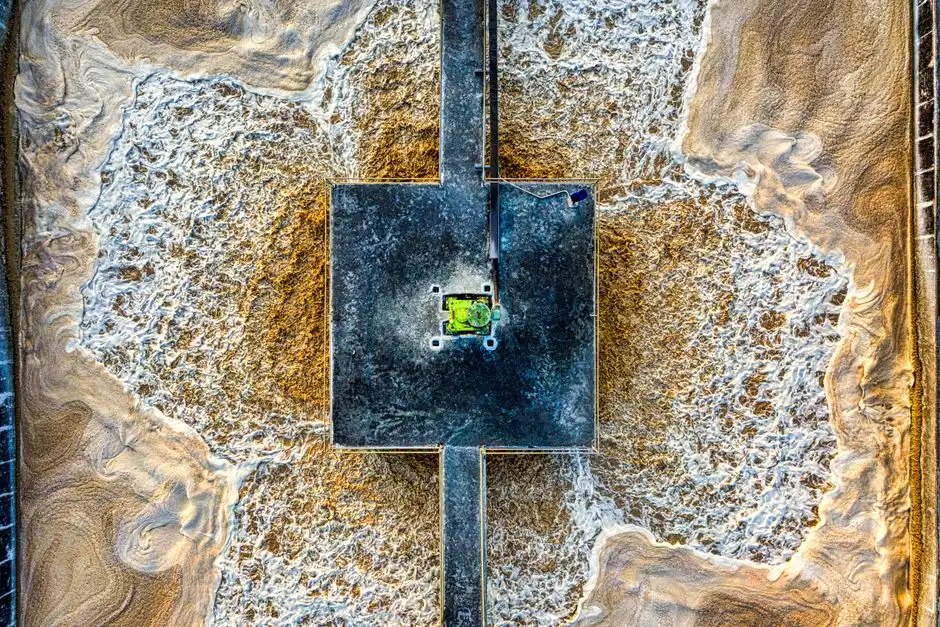
Pin this in the control room. Values are typical operating bands for municipal and light-industrial MBBRs; high-strength industrial loads may run tighter.
| Parameter | Target Band | Alarm Threshold | Compliance Linkage (2026) |
|---|---|---|---|
| Dissolved oxygen — carbon removal | 2-4 mg/L | <1.5 mg/L for >30 min | BOD <10 mg/L (EU UWWTD 91/271/EEC) |
| Dissolved oxygen — nitrification | 4-6 mg/L | <2 mg/L | NH3-N seasonal limits (EPA 2024) |
| pH | 6.5-8.5 | Outside 6.0-9.0 | GB 18918-2002 amended Class 1A |
| F/M ratio | 0.2-0.5 lb BOD/lb MLVSS-day | <0.1 or >0.8 | Process stability indicator |
| Media fill | 40-67% (typical 50%) | <30% | Design retention safeguard |
| HRT | 4-24 h | <3 h peak | Design loading envelope |
| Temperature | >10°C (full nitrification >12°C) | <8°C sustained | Seasonal permit window |
| Alkalinity | >100 mg/L as CaCO3 | <80 mg/L as CaCO3 | Nitrification buffer |
| Hydraulic loading rate | 1.5-3.0 m³/m²·h | >3.0 m³/m²·h peak | Carrier retention safeguard |
| Effluent NH3-N | <2 mg/L | Rise >50% from 7-day mean | EPA 2024 nutrient criteria |
Building a 2026-Ready MBBR Monitoring and Prevention Plan
Reactive MBBR troubleshooting is expensive at 3 a.m. Move from grab-sampling to online sensors: an NH3-N ion-selective probe, an optical DO sensor, a pH/temperature multi-parameter sonde, and an in-line TSS meter. Daily KPIs to trend are NH3-N removal rate, DO profile, F/M ratio, mixed-liquor color, foam height, and sieve pressure differential. Set alarms for NH3-N rise >50% from a 7-day rolling mean. Also alarm DO below 1.5 mg/L for more than 30 minutes, pH outside 6.0-9.0, and foam height above 300 mm. The fault diagnosis in wastewater treatment plants engineering guide covers ML-based early warning systems and PLC integration patterns for 2026. The PLC control for industrial wastewater plants guide details the alarm and interlock architecture that ties the sensors to your SCADA.
Connect the plan to lifecycle economics: a monitoring retrofit typically reduces MBBR OPEX by 15-25% over 5 years by catching failures before they become permit excursions (HydropureWater field data, 2026). For polishing MBBR effluent to reuse or tight discharge limits, integrated MBR systems downstream of the MBBR stage are a common 2026 retrofit path.
Decision Flowchart — Text-Described
- Carriers in clarifier? → Fault #1 (sieve/hydraulic).
- Pale carriers, COD dropping? → Fault #2 (toxicity/F/M shock).
- NH3-N above permit? → Fault #3 (DO, pH, temperature, media fill).
- Foam or caked carriers? → Fault #4 (surfactant, F/M, precipitation).
- None of the above? → check influent distribution, airlift pump rotation, and recent feed changes; sample carrier fill and biofilm thickness to confirm biology is intact.
Who This Is For / Next Step
This guide is for plant engineers, EPC process leads, and operations supervisors running municipal or light-industrial MBBRs who need numeric thresholds, not brochure language. Look elsewhere if you need a full activated-sludge SVI playbook or membrane integrity diagnostics. If media fill, sieve slot size, or aeration retrofit still sit undecided, gather influent COD, NH3-N, temperature, and current media fill fraction. Send them through a request for quote so the sizing band can be checked against your permit window.
Frequently Asked Questions
What is the most common cause of media washout in MBBRs?
Damaged sieves account for roughly 60% of media washout cases, followed by hydraulic overload above 3.0 m³/m²·h during peak flow. Inspect the perforated plate or cylindrical sieve for cracks first, then measure actual hydraulic loading against the 1.5-3.0 m³/m²·h design band. Cap peak HLR near 2.5 m³/m²·h with equalization if the audit shows repeated overload. Carrier attrition under 2% per year rarely explains a sudden dump.
How long does it take an MBBR to recover from a toxicity event?
Visible biofilm recovery takes 5-10 days; full nitrification recovery takes 14-21 days at 20°C after a toxic slug, provided aeration is held at DO 4-6 mg/L and feed is ramped over 48-72 hours. Isolate the toxic source before re-seeding from residual carriers. Plan resampling for COD at day 5 and NH3-N at day 14 so you do not declare recovery too early.
What DO level is required for nitrification in an MBBR?
The nitrification zone requires DO 4-6 mg/L; below 2 mg/L sustained, nitrification fails and NH3-N rises above permit within hours. Profile DO across the reactor length, not just at the effluent end. Cold weather below 12°C needs media fill raised toward 50-60% and F/M held below 0.3 while DO stays at 5+ mg/L.
Can you chlorinate an MBBR to control foam or caked media?
Yes, but only as a targeted dose of 2-5 mg/L for 30 minutes to trigger controlled sloughing. Continuous chlorination kills all biomass and forces a 14-21 day re-seed, which is almost always the wrong economic choice. Prefer a brief high-DO spike at 6-8 mg/L for 4-6 hours first when foam is surfactant-driven rather than filament-locked.
What media fill percentage should an MBBR hold for stable nitrification?
Media fill of 40-67% is typical, with 50% the design sweet spot for most municipal loads. Fill below 30% is an alarm condition and often accompanies NH3-N spikes above 10 mg/L when DO or temperature are already marginal. After cold shock, raise fill to 50-60% for about 7 days while seeding 10-20% returned sludge, then return to attached-growth operation.