Why Landfill Leachate Remains the Hardest Wastewater Stream
Landfill leachate treatment in 2026 still rests on five stages: equalization, physicochemical pretreatment, biological treatment, membrane polish, and concentrate management. Young streams with BOD/COD above 0.5 can lean on MBR; mature streams with BOD/COD below 0.1 need Fenton or ozone ahead of NF or RO. Hitting COD 100 mg/L from a 50,000 mg/L influent needs about 99.8% cumulative removal.
This wastewater forms when rainwater percolates through solid waste and dissolves heavy metals, polyphenols, volatile organic compounds, microorganisms, and ammonium ions (Springer, 2024). Design difficulty comes from how fast the influent changes. Typical COD ranges from 5,000 mg/L in young cells to 80,000 mg/L in mature, acidic, methanogenically stabilized cells. NH3-N can climb past 5,000 mg/L while the BOD/COD ratio collapses from above 0.5 to below 0.1.
Forced-aeration reclamation studies confirm that the matrix keeps shifting long after a cell is capped. In accelerated-reactor trials on refuses aged 1 to 13 years, the BDM removal rate fell from 5.2% (1-year refuse) to 2.4% (13-year refuse) at 0.12 L O₂/kg DM/day. The degradation-rate constant K declined linearly with disposal age (K = −0.0002193·x + 0.0091, R² = 0.854) (Waste Disposal & Sustainable Energy, 2024-09). Stabilized refuse still leaches, but the organics are far harder to break down.
That shift is why biological-only designs fail on mature streams. Once the BOD/COD ratio drops below 0.1, the carbon is refractory humic and fulvic acid rather than volatile fatty acids, and ammonia toxicity to nitrifiers rises sharply. A defensible 2026 train therefore pairs an advanced oxidation step (Fenton or ozone) with a membrane barrier (NF or RO). Equalization must also be sized generously enough to absorb the shock loads that climate and waste-mix swings deliver to the head of the plant.
The 2026 Treatment Train: Stage by Stage
A complete 2026 leachate treatment train runs through five sequential stages. Each stage has a defined removal target so the engineer can size the next step from the previous effluent rather than from the raw influent alone.
| Stage | Unit operation | Typical equipment | Cumulative COD removal | Key design parameter |
|---|---|---|---|---|
| 1. Screening & equalization | Rotary bar screen + EQ tank | GX series rotary mechanical bar screen, 1-3 mm aperture | 0-5% | 12-24 h hydraulic retention; dampens COD and flow swings |
| 2. Physicochemical pretreatment | Fenton / air stripping / coagulation-DAF | Fenton reactor (Fe²⁺/H₂O₂), ammonia stripper, DAF system for physicochemical pretreatment | 30-50% | Fenton pH 3-3.5, H₂O₂/COD 1.5-2.0; air strip at pH 10.5-11.5, 30-40°C when NH3-N >1,000 mg/L |
| 3. Biological treatment | MBR / SBR / UASB | Tubular or flat-sheet PVDF integrated MBR wastewater treatment system | 60-85% of remaining COD | Submerged MBR pore <1 μm; MLSS 8,000-15,000 mg/L; ~60% smaller footprint vs. CAS |
| 4. Membrane polish | NF or RO | Industrial RO system for leachate polishing; plate-and-frame RO for variable feed | 95-99% of remaining TDS and refractory COD | Recovery 75-85% (RO), 80-90% (NF); CIP every 4-8 weeks |
| 5. Concentrate management | Evaporation, crystallizer, re-injection | Forced-circulation evaporator, brine crystallizer, or return line to cell | N/A (volume reduction) | Concentrate is typically 15-25% of RO feed volume; ZLD required where no outfall exists |
Stage 1 is straightforward but routinely undersized. A 12-24 h equalization basin blunts the diurnal COD swings that otherwise hammer downstream Fenton stoichiometry. Most plants we size for mature cells still undershoot EQ volume on the first draft, then pay for it in reagent overshoot.
Stage 2 splits into two parallel decisions. Use Fenton oxidation when COD and color must drop. Use ammonia air stripping when NH3-N exceeds 1,000 mg/L. PLC-controlled chemical dosing for Fenton and coagulation holds reagent ratios within ±5% of setpoint.
Stage 3 is where an MBR earns its footprint. Submerged modules with <1 μm pores retain sludge at MLSS 8,000-15,000 mg/L and deliver a near-reuse-quality effluent that protects the Stage 4 RO from organic fouling. Stage 4 plate-and-frame RO can drive recovery to 100% in some configurations and tolerates the higher TSS spikes that would shut down spiral-wound elements (Kaimi Membrane, 2025; PCI Membranes, 2025). Stage 5 is the OPEX hotspot that most CAPEX estimates underfund.
Technology Comparison: MBR, Fenton, NF, and Plate-and-Frame RO
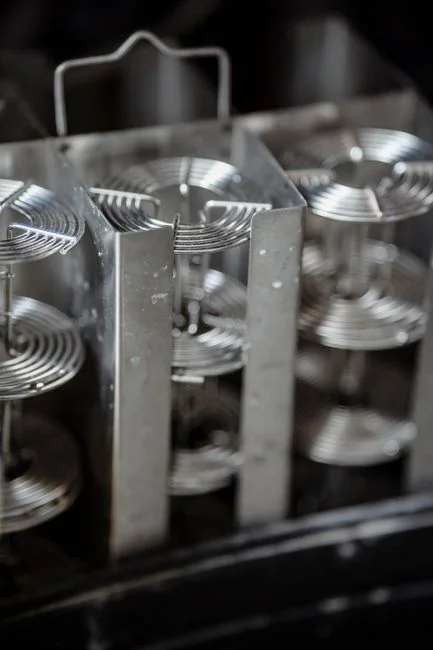
MBR, Fenton, NF, and plate-and-frame RO cover most 2026 leachate trains. The matrix below maps each option to removal performance, OPEX drivers, and best-fit leachate age.
| Technology | COD removal | NH3-N removal | TDS removal | Influent tolerance | OPEX driver | Best-fit leachate age |
|---|---|---|---|---|---|---|
| Tubular MBR (external crossflow) | 70-90% | 80-95% (with nitrification) | Minimal | High TSS, high oil/grease | Energy (crossflow pump), CIP chemicals | Young to transition (<10 yr) |
| Submerged flat-sheet MBR (DF series) | 60-85% | 80-95% | Minimal | Moderate TSS, requires good pretreatment | Aeration energy, membrane replacement | Young to transition |
| Fenton oxidation | 40-70% | Negligible | Negligible | High COD, refractory organics | H₂O₂, FeSO₄, sludge handling | Mature, stabilized (>10 yr) |
| Nanofiltration (NF) | 60-85% | 30-60% | 40-70% | Low to moderate TDS, low TSS | Membrane replacement, energy | Transition, partial desalination |
| Plate-and-frame RO | 95-99% | 95-99% | 95-99% | High TSS (up to ~50 mg/L feed), variable composition | Energy, CIP, concentrate disposal | Mature, reuse, surface discharge |
Young leachate with BOD/COD above 0.5 carries enough biodegradable carbon to justify an MBR-led train, with Fenton held in reserve for color or shock loads. Mature leachate with BOD/COD below 0.1 needs Fenton ahead of the membrane to break refractory organics down to a size the RO can reject. Biological treatment then acts as a nitrification buffer for the high NH3-N loading. Tubular MBR systems run at flux rates 6-10 times higher than common submerged modules and reach a 6-year service life under proper CIP — the metric that justifies their higher CAPEX (Kaimi Membrane, 2025).
For the membrane polish, plate-and-frame RO uses up to 26% less pump power than comparable plate-frame designs and ships containerized. It can be installed without shutting down the existing biological train (PCI Membranes, 2025). DF series flat-sheet MBR membrane modules are individually replaceable at 0.1 μm pore. Units in the 80-225 m² range deliver 32-135 m³/day each and suit retrofits that must expand biology without civil work.
2026 Discharge Limits and Compliance Targets
Three regulatory regimes cover most 2026 leachate discharge decisions, and each drives technology choice differently. The EU Landfill Directive 1999/31/EC as amended by 2018/850 sets COD at the landfill outlet at roughly 200 mg/L in several member-state transpositions, with BOD near 30 mg/L. The actual NH3-N limit depends on the receiving environment.
China's GB 16889-2008 (with the 2024-2025 amendment cycle) and GB/T 31962-2015 set tiered limits for leachate discharged to municipal sewers versus surface water. The surface-water class tightens COD to 100 mg/L and NH3-N to 25 mg/L in most provinces. The US framework — EPA Subtitle D and 40 CFR 258 — requires leachate management but defers numeric limits to NPDES permits. Typical surface-discharge permits floor at COD 100-300 mg/L and NH3-N 10-30 mg/L.
The arithmetic matters: a 50,000 mg/L COD influent needs roughly 99.8% cumulative removal to hit a 100 mg/L surface-water limit. Physicochemical plus MBR alone tops out near 95-97% removal, which is why any plant targeting surface discharge or reuse must include an RO polish. For a sewer-discharge destination the bar is lower — typically COD 500-1,000 mg/L — and a well-run MBR can clear it. Most municipal treatment plants will still demand a pretreatment bond to cover the ammonia load. The 2026 pH discharge limit reference gives the full jurisdictional table. For leachate work the binding constraints are almost always COD, NH3-N, and TDS, in that order.
CAPEX and OPEX Benchmarks for 2026
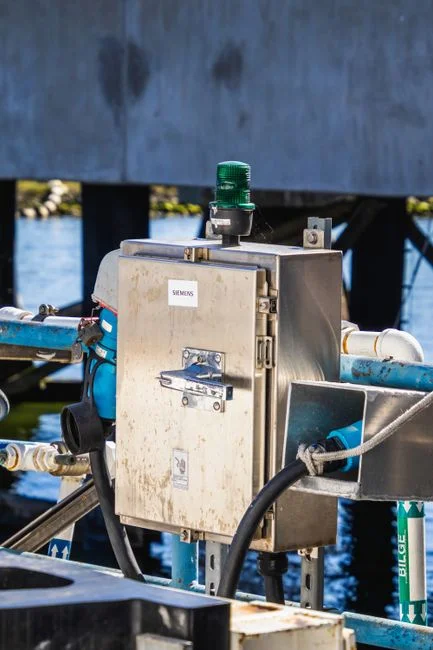
Leachate plant CAPEX and OPEX in 2026 fall in a narrow enough band to defend in a budget review. The table below gives the engineer a defensible range to put in front of procurement (HydropureWater field data, 2026).
| Plant capacity | Typical configuration | CAPEX range (USD, 2026) | OPEX range (USD/m³) | Notes |
|---|---|---|---|---|
| 50 m³/day (packaged) | Screening + EQ + Fenton + MBR + RO | $0.30M-$0.80M | $0.80-$1.80 | Containerized; concentrate shipped offsite |
| 100-500 m³/day | Full train, civil EQ basin | $0.6M-$4.2M | $0.55-$1.40 | Concentrate to evaporation pond or crystallizer |
| 500-2,000 m³/day | Two-stage MBR + Fenton + RO with ZLD | $4M-$18M | $0.45-$1.10 | Onsite evaporator for concentrate; OPEX falls with scale |
| Coastal site (any size) with sea outfall | Brine outfall permitted | -15% CAPEX (no evaporator) | $0.30-$0.80 | Concentrate disposal is the dominant OPEX line |
OPEX splits predictably across five lines. Energy takes 35-45% (crossflow pumping, RO high-pressure pumps, aeration). Fenton and coagulant chemicals take 15-25%. Membrane replacement takes 10-15%, labor 10-15%, and concentrate disposal 10-20%. The last line collapses a budget when no cheap disposal route exists.
Cross-check the biological-stage operating cost against the MBBR maintenance cost benchmarks for 2026 and the IFAS operating cost data for 2026. They are not leachate-specific, but their aeration and sludge-handling lines bracket what a well-tuned MBR should consume.
Decision Framework: Which Train Fits Your Landfill?
Four questions, answered in order, will point any engineer at a defensible 2026 train configuration.
- What is the landfill age? Under 5 years (BOD/COD >0.5) → MBR-led train with light pretreatment. At 5-15 years (BOD/COD 0.1-0.5) → two-stage MBR with coagulant or low-dose Fenton polishing. Over 15 years (BOD/COD <0.1, NH3-N >2,000 mg/L) → full Fenton + RO train, with air stripping added when NH3-N exceeds 1,000 mg/L before the biological stage.
- Where is the effluent going? Municipal sewer is less stringent; a biological train may suffice with flow equalization. Surface water almost always needs RO. Reuse for landfill operations or dust control makes RO mandatory, often with a UV or chlorine residual step.
- What is the influent salinity? Low TDS (<5,000 mg/L) may stop at NF if the discharge destination tolerates partial salt passage. High TDS forces RO regardless.
- Where does the concentrate go? If no cheap route exists, budget a forced-circulation evaporator or crystallizer. Or fall back to lower-recovery NF plus volume reduction and accept the higher reject volume. Re-injection to the active cell is the lowest-cost option where geochemistry allows it.
The output of those four questions is a configuration, not a sales quote. For a 200 m³/day mature leachate stream headed to surface water with no sea outfall, use screening → 18 h EQ → ammonia stripping → Fenton → DAF → MBR → RO → forced-circulation evaporator. CAPEX lands in the $2.5M-$4M band and OPEX at $0.70-$1.20/m³.
For a 50 m³/day young leachate stream going to a municipal sewer, screening → 12 h EQ → coagulation-DAF → MBR is often enough, and CAPEX lands under $0.8M. Compact sites may also need a buried footprint for secondary or domestic streams. Pair the leachate train with an Underground Package Sewage Treatment Plant (WSZ Series) for those non-leachate sanitary loads without expanding the civil package.
Selection checklist before freezing the P&ID
- Confirm BOD/COD and NH3-N on at least four seasonal samples, not a single grab.
- Lock the discharge destination (sewer, surface water, or reuse) before choosing NF vs RO.
- Size EQ for 12-24 h hydraulic retention at peak diurnal COD, not average day flow.
- Budget concentrate disposal as a line item, not a contingency; 15-25% of RO feed volume is typical.
- Specify CIP every 4-8 weeks and membrane life targets (4-6 years tubular MBR; 3-5 years plate-and-frame RO).
- Compare energy share (35-45% of OPEX) against aeration and high-pressure pump curves at design flux.
- If NH3-N exceeds 1,000 mg/L, place air stripping before biology at pH 10.5-11.5 and 30-40°C.
Who this is for. Landfill operators, EPC contractors, and procurement teams sizing a new leachate plant or retrofitting an undersized biological train for 2026 discharge rules. Who should look elsewhere. Sites that only need sanitary or low-strength industrial treatment without a leachate matrix should start with a standard package plant, not a Fenton-RO train. Next step. Send influent COD, BOD/COD, NH3-N, TDS, flow (m³/d), and the discharge destination so the train can be sized against the ranges above — request a leachate treatment quote with those four numbers attached.
Frequently Asked Questions
What is the typical BOD/COD ratio for young vs mature leachate?
Above 0.5 for young leachate under 5 years old, dropping below 0.1 for mature or stabilized leachate over 10-15 years old. This ratio is the single most important design variable. It determines whether biological treatment will carry the load or whether the train needs Fenton plus RO to close the gap to surface-water or reuse limits.
Can MBR alone meet leachate discharge limits?
Rarely. MBR effluent typically achieves COD 100-500 mg/L and NH3-N 5-20 mg/L under stable operation. That clears most sewer-discharge thresholds but almost never meets surface-water or reuse standards without an RO polish. The MBR's job is to protect the RO from organic fouling, not to be the final barrier.
How much does leachate treatment cost per m³ in 2026?
$0.45-$1.80/m³ across the typical plant-size range, dominated by concentrate disposal and energy. Coastal sites with a permitted brine outfall can fall below $0.30/m³ because the evaporator line is removed. Packaged 50 m³/day plants sit at the high end; 500-2,000 m³/day ZLD trains sit lower on a unit-cost basis.
What is the typical membrane service life in a leachate plant?
4-6 years for tubular MBR membranes with proper CIP, and 3-5 years for plate-and-frame RO membranes depending on feed quality and cleaning frequency. Both numbers assume an operator who logs CIP cycles every 4-8 weeks and replaces seals on schedule. Skipping CIP is the fastest way to cut that life in half.
Is plate-and-frame RO worth the premium over spiral-wound?
For landfill sites with variable feed, plate-and-frame handles higher TSS (up to ~50 mg/L feed) with less pretreatment. It uses up to 26% less pump power than comparable plate-frame designs and ships containerized for fast deployment. A roughly 15-25% higher CAPEX often pays back in lower pretreatment cost and shorter installation windows.