Industrial wastewater treatment in Kuching: what changed in 2026
Industrial wastewater treatment in Kuching is driven by DOE discharge limits, land limits in Pending and Demak Laut, and rising energy share of OPEX. For a 200 m³/day food plant, CAPEX still spans about RM 2.4M for chemical DAF trains to about RM 4.8M for MBR, with OPEX near RM 1.20–RM 2.10/m³ treated. Decentralized MBR or DAF trains remain the practical default when central STP capacity is constrained.
Earlier plant briefs often cited COD ≤ 50 mg/L and TSS ≤ 20 mg/L as “Class A” targets. According to the Environmental Quality (Industrial Effluent) Regulations 2009 Fifth Schedule, Standard A for most industries is COD ≤ 80 mg/L and suspended solids ≤ 50 mg/L, with BOD₅ ≤ 20 mg/L at 20 °C (DOE Malaysia). Standard B is COD ≤ 200 mg/L and SS ≤ 100 mg/L on the same schedule. Design to the licensed schedule on the site permit, not to informal targets copied from another plant.
EQA amendments in 2024 strengthened enforcement and raised penalty exposure for non-compliant discharges (WEPA Annual Meeting materials, 2025). Original compliance briefs for Kuching still quote RM 50K–RM 500K fine bands for repeated exceedances; treat those as planning risk, then confirm current compoundable offence schedules with counsel. Kuching’s industrial mix remains food processing, electronics, and palm oil. Reported industrial wastewater volume growth near 12% per year (Sarawak Economic Development Corporation, 2023) keeps pressure on compact trains. Energy often takes about 40% of OPEX and has been rising near 8% year-over-year in Sarawak, so MBR at 0.6–0.8 kWh/m³ usually beats conventional activated sludge at 1.2–1.5 kWh/m³ on long-run cost when land is scarce.
As of 30 June 2026, the Kuching Centralised Wastewater Management System reported 104,470 PE connected (Sewerage Services Department Sarawak). That central load helps domestic flows, yet many factories still need on-site industrial pretreatment before sewer discharge or river outfall. Most plants we size for Pending and Demak Laut therefore separate sanitary package units from process COD and metals trains.
Kuching’s top 3 industrial sectors: effluent profiles and treatment needs
Food, electronics, and palm oil plants in Kuching set different design bases for COD, TSS, FOG, metals, and pH. Matching the train to the sector profile is the first sizing decision before CAPEX comparison.
Food processing: Typical COD runs 1,200–3,500 mg/L with TSS 300–800 mg/L and FOG 200–500 mg/L. Flows of 50–300 m³/day are common. Most plants we size for this sector run biological HRT near the lower end of 6–8 hours after FOG control. DAF with pH held at 6.5–7.5 cuts FOG and TSS before biology; MBR finishes COD and SS for Standard A discharge.
Electronics: TSS is often only 50–200 mg/L, but dissolved solids and metals dominate. Influent copper and nickel can approach 1.0 mg/L and 0.5 mg/L respectively, while Standard A discharge limits are copper ≤ 0.20 mg/L and nickel ≤ 0.20 mg/L, with arsenic ≤ 0.05 mg/L (IER 2009 Fifth Schedule). Flows of 20–150 m³/day usually need MBR plus RO when reuse is required. Where arsenic is present, sulfide precipitation is one metals path used before membrane stages; confirm sludge classification and sulfide residual before disposal or sewer discharge.
Palm oil: COD of 2,500–6,000 mg/L, TSS of 1,000–3,000 mg/L, pH 4.0–5.5, and high FOG make DAF pretreatment essential. DAF can remove 90–95% of TSS and FOG under stable dosing. Flows of 100–500 m³/day often need DAF plus anaerobic digestion or MBR polishing to hold licensed limits. Acidic influent must be neutralized before biology or membranes, or you will lose floc and flux in the first week.
| Industry | Typical Flow Rate (m³/day) | COD (mg/L) | TSS (mg/L) | FOG (mg/L) | Key Contaminants | Primary Treatment Needs | Typical Retention Time (Hours) |
|---|---|---|---|---|---|---|---|
| Food Processing | 50–300 | 1,200–3,500 | 300–800 | 200–500 | Organic Load, FOG | Biological Treatment (MBR), DAF + pH Adjustment | 6–8 (Biological) |
| Electronics | 20–150 | 800–2,000 | 50–200 | N/A | Heavy Metals (Cu, Ni), Dissolved Solids | MBR + RO | N/A (focus on advanced filtration) |
| Palm Oil | 100–500 | 2,500–6,000 | 1,000–3,000 | High | Acidic pH, High Organic Load, FOG | DAF Pre-treatment, Anaerobic Digestion, MBR | N/A (focus on pre-treatment efficiency) |
Technology selection: MBR vs DAF vs chemical treatment for DOE limits
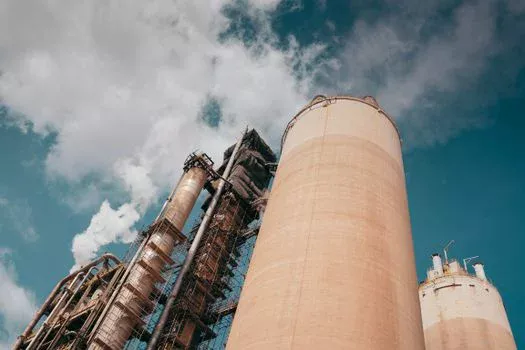
Technology choice in Kuching balances licensed effluent quality, land, and OPEX. Use the numbers below as planning bands, then lock them with site jar tests and peak-flow data from at least one monsoon month.
MBR (Membrane Bioreactor): Footprint is typically 0.5–1.0 m²/m³/day. Effluent often reaches COD below 30 mg/L and TSS below 5 mg/L when biology is stable, which sits inside Standard A for most schedules. CAPEX runs RM 12,000–RM 15,000 per m³/day; OPEX is about RM 1.50–RM 2.10/m³ from energy and membrane care. For food and electronics sites short on land, MBR systems for Kuching’s land-constrained industrial sites remain a strong full-train option and can support reuse after RO.
DAF (Dissolved Air Flotation): DAF fits high TSS and FOG loads in food and palm oil. Removal of 90–95% of those fractions is typical with correct flocculation. CAPEX is about RM 8,000–RM 10,000/m³/day and OPEX about RM 0.90–RM 1.40/m³. PAC dosing of 50–100 mg/L is common. DAF alone often leaves residual COD above Standard A, so plan post-treatment. DAF systems for high-TSS effluent in Kuching’s palm oil and food processing plants work best as pretreatment.
Chemical treatment (coagulation + sedimentation): CAPEX is lowest at RM 5,000–RM 7,000/m³/day, but OPEX of RM 1.20–RM 1.80/m³ rises with sludge haulage at RM 200–RM 400 per ton. The train removes solids well, yet COD polishing is often still required for Standard A. High sludge mass is the hidden cost that shows up after the first year.
Hybrid DAF + MBR: Palm oil and other sticky organics often need DAF ahead of MBR. CAPEX near RM 18,000–RM 22,000/m³/day can cut energy about 30% versus a standalone MBR of equal capacity when FOG load is high, because membranes see a cleaner feed. That hybrid path is the usual recommendation when raw COD stays above 2,500 mg/L for weeks at a time.
| Technology | CAPEX (RM/m³/day) | OPEX (RM/m³) | Footprint (m²/m³/day) | Compliance Risk (1–5) | Best For |
|---|---|---|---|---|---|
| MBR | 12,000–15,000 | 1.50–2.10 | 0.5–1.0 | 1 | Land scarcity, high effluent quality needs, water reuse |
| DAF | 8,000–10,000 | 0.90–1.40 | 0.2–0.4 | 3 (may require post-treatment for Class A) | High TSS/FOG, pre-treatment |
| Chemical Treatment | 5,000–7,000 | 1.20–1.80 | 0.3–0.6 | 4 (struggles with stringent COD/TSS) | Low CAPEX, high sludge generation |
| DAF + MBR Hybrid | 18,000–22,000 | 1.30–1.90 | 0.7–1.4 | 1 | Challenging effluents (e.g., palm oil), guaranteed Class A |
What if a treatment system never reaches design flow?
A unit that fails design flow from day one is a structural risk, not a tuning issue. Restoring nominal pressure, temperature, or chemical dose may still leave the train short of rated capacity. Investigate membrane fouling, incorrect flux, undersized pumps, hydraulic short-circuiting, and influent variability before you resize downstream tanks or add polishing stages. Most plants we audit after early underperformance find the root cause in pretreatment or hydraulics, not in a single instrument reading. Freeze corrective CAPEX until that investigation is written down with measured flows.
Engineering specs for DOE-compliant systems in Kuching
Engineering specs for Kuching plants must hold peak monsoon flows and licensed discharge limits at the same time. Size on measured peaks, not brochure averages.
Flow rates: Design for peak hourly flow up to 1.5× average daily flow. A 200 m³/day average plant should hold about 300 m³/day peak. November–February monsoon patterns can lift factory washdown and storm ingress, so hydraulic overload checks matter on equalization volume and pump duty points.
Retention times: MBR HRT is typically 6–8 hours. DAF HRT is about 20–30 minutes (0.33–0.5 h). Chemical sedimentation needs about 2–4 hours for floc settleability. Short HRT on biology is the fastest way to miss COD limits after a production surge.
Chemical dosing: PAC for DAF often sits at 50–100 mg/L. Hold pH at 6.5–7.5 with NaOH where biology or coagulation needs it. Sludge conditioning polymers of 1–3 mg/L support dewatering. Automated chemical dosing systems for Kuching’s DOE-compliant pH adjustment and coagulation keep dose stable when influent swings.
Footprint and energy: MBR needs 0.5–1.0 m²/m³/day at 0.6–0.8 kWh/m³. DAF needs 0.2–0.4 m²/m³/day at 0.3–0.5 kWh/m³. Chemical trains need about 0.3–0.6 m²/m³/day at 0.4–0.6 kWh/m³. Plot these against your available yard before you commit to civil works.
Maintenance: Weekly MBR CIP with 2% citric acid for a 30-minute soak is a common baseline. Inspect DAF grease traps and skimmers daily. Keep the plate-frame filter press media clean so cake solids stay predictable and haulage tickets do not spike.
| Parameter | MBR | DAF | Chemical Treatment | Units |
|---|---|---|---|---|
| Peak Flow Factor | 1.5 | 1.5 | 1.5 | - |
| Hydraulic Retention Time (HRT) | 6–8 | 0.33–0.5 (20-30 min) | 2–4 | Hours |
| PAC Dosing (DAF) | N/A | 50–100 | N/A | mg/L |
| pH Adjustment (NaOH) | 6.5–7.5 | 6.5–7.5 | 6.5–7.5 | Range |
| Polymer Dosing (Sludge) | 1–3 | 1–3 | 1–3 | mg/L |
| Footprint | 0.5–1.0 | 0.2–0.4 | 0.3–0.6 | m²/m³/day |
| Energy Consumption | 0.6–0.8 | 0.3–0.5 | 0.4–0.6 | kWh/m³ |
| Membrane Cleaning (MBR) | Weekly CIP (2% Citric Acid) | N/A | N/A | - |
| Skimmer Maintenance (DAF) | N/A | Daily | N/A | - |
CAPEX and OPEX breakdown for Kuching industrial plants

CAPEX and OPEX for Kuching industrial plants split into equipment, civil works, permits, energy, labor, chemicals, and sludge. Budget both capital and 10-year ownership before selecting a vendor package.
CAPEX split: Equipment is about 60%, civil works about 25%, and permitting about 15%. DOE pretreatment approval can run RM 50K–RM 200K. An EIA, when triggered, often costs RM 100K–RM 300K depending on scale. Skipping permit cost in the first budget is a common reason projects stall after equipment is already ordered.
OPEX split: Energy is about 40%, labor about 30%, chemicals about 15%, sludge disposal about 5–10%, and routine spares about 5%. For septic sludge treatment and disposal in Sarawak, one published public-plant figure is RM 112.20 per m³ (Sewerage Services Department Sarawak, Sibu plant data), which shows why sludge volume drives chemical-train OPEX even when CAPEX looks cheap.
200 m³/day benchmarks: MBR CAPEX RM 2.4M–RM 3.0M (RM 12,000–RM 15,000/m³/day) with OPEX RM 1.50–RM 2.10/m³. DAF CAPEX RM 1.6M–RM 2.0M with OPEX RM 0.90–RM 1.40/m³. Chemical treatment CAPEX RM 1.0M–RM 1.4M with OPEX RM 1.20–RM 1.80/m³. Compact sites that cannot expand tanks often shortlist an Underground Package Sewage Treatment Plant (WSZ Series) for sanitary streams beside the industrial train.
| System Capacity (m³/day) | Technology | Estimated CAPEX (RM) | Estimated OPEX (RM/m³) | Estimated 10-Year TCO (RM) |
|---|---|---|---|---|
| 50 | MBR | 600,000 – 750,000 | 1.50 – 2.10 | 1,350,000 – 1,950,000 |
| DAF | 400,000 – 500,000 | 0.90 – 1.40 | 850,000 – 1,400,000 | |
| Chemical Treatment | 250,000 – 350,000 | 1.20 – 1.80 | 950,000 – 1,550,000 | |
| 200 | MBR | 2,400,000 – 3,000,000 | 1.50 – 2.10 | 5,400,000 – 7,800,000 |
| DAF | 1,600,000 – 2,000,000 | 0.90 – 1.40 | 3,400,000 – 5,400,000 | |
| Chemical Treatment | 1,000,000 – 1,400,000 | 1.20 – 1.80 | 3,800,000 – 5,800,000 | |
| 500 | MBR | 6,000,000 – 7,500,000 | 1.50 – 2.10 | 13,500,000 – 19,500,000 |
| DAF | 4,000,000 – 5,000,000 | 0.90 – 1.40 | 8,500,000 – 14,000,000 | |
| Chemical Treatment | 2,500,000 – 3,500,000 | 1.20 – 1.80 | 9,500,000 – 15,500,000 |
What do piping and tank disinfection typically cost?
Piping and tank disinfection costs vary with volume, access, chemical type, and downtime window. Main drivers are tank volume, pipe length and diameter, chlorine or peroxide dose, neutralization and discharge of spent solution, scaffolding or confined-space entry, and production lost hours. Ask vendors for a line-item quote tied to your P&ID and hydrotest plan rather than a single lump sum. Pair disinfection scope with the same commissioning plan used for DOE sampling so sterile lines do not become a schedule surprise after mechanical completion.
DOE permitting timeline and documentation checklist
DOE permitting for Kuching factories usually starts with pretreatment approval and, above set capacity thresholds, an EIA. Incomplete sampling packages are the most common delay we see on Sarawak industrial sites.
Pretreatment approval: Timeline is typically 6–12 months. Provide at least three months of effluent data for COD, TSS, pH, and metals, plus site plans and design drawings. Incomplete packs extend review and can push civil start dates past monsoon windows.
EIA: Systems above about 100 m³/day often trigger an EIA lasting 3–6 months at RM 100K–RM 300K. The report must show impacts and mitigation, not only equipment catalogs. Electronics plants should include full metals panels early so arsenic, copper, and nickel are not added as late revisions.
Inspections: Unannounced checks compare discharge to the licensed Standard A or B limits. Earlier briefs used COD ≤ 50 mg/L and TSS ≤ 20 mg/L as internal targets; licensed Standard A under IER 2009 is COD ≤ 80 mg/L and SS ≤ 50 mg/L for most industries, unless a sector schedule is stricter. Keep self-monitoring records aligned to the permit, not to marketing claims.
Documentation checklist:
- Effluent quality data (minimum 3 months for COD, BOD, TSS, pH, heavy metals)
- Process Flow Diagrams (PFDs) and Piping & Instrumentation Diagrams (P&IDs)
- Chemical Safety Data Sheets (SDS) for all treatment chemicals
- Operator training and certification plans
- Site layout with treatment plant and discharge points
- Risk assessment and mitigation plans
Supplier selection checklist for Kuching equipment
Supplier selection for Kuching plants should weight local service as heavily as membrane brand. A cheap skid with no Sarawak spare parts stock fails at the first night alarm. For factories comparing local vendors, score response time and spare-parts stock before you score brochure COD claims.
Selection checklist:
- Documented effluent guarantees aligned to your licensed Standard A or B limits (for example COD ≤ 80 mg/L and SS ≤ 50 mg/L where Standard A applies)
- Local response target ≤ 4 hours and spare parts held in Sarawak
- Footprint ≤ 1.0 m²/m³/day for MBR on tight Pending or Demak Laut plots
- Energy ≤ 0.8 kWh/m³ for MBR and ≤ 0.5 kWh/m³ for DAF at design flow
- Chemical delivery ≤ 48 hours for PAC and NaOH inside Kuching
- Proven DOE drawing packages and commissioning records in Malaysia
- Clear scope for sanitary side-streams via packaged units such as the Underground Package Sewage Treatment Plant (WSZ Series) when factory domestic waste is separate from process effluent
| Evaluation Criteria | Maximum Points | Your Score | Supplier 1 Score | Supplier 2 Score |
|---|---|---|---|---|
| DOE Certification & Effluent Guarantees | 20 | |||
| Local Service & Support (24/7, Response Time ≤ 4h) | 15 | |||
| Spare Parts Availability in Sarawak | 15 | |||
| Footprint Efficiency (e.g., MBR ≤ 1.0 m²/m³/day) | 10 | |||
| Energy Efficiency (e.g., MBR ≤ 0.8 kWh/m³) | 10 | |||
| Chemical Supply Chain Reliability (Delivery ≤ 48h) | 10 | |||
| Experience with Sarawak DOE Permitting | 10 | |||
| Overall Technical Solution & Innovation | 10 | |||
| Total Score | 100 |
Who this is for and next step
This guide is for plant engineers, EPC contractors, and procurement managers sizing food, electronics, or palm oil effluent trains in Kuching. Look elsewhere if you only need domestic sewage without industrial COD or metals. Industrial wastewater treatment in Kuching projects move faster when lab sheets, peak-flow logs, and land sketches arrive with the first inquiry. To compare MBR, DAF, or hybrid packages against your lab data and land plan, request a technical quote with your flow and COD sheet.
Frequently Asked Questions
What are DOE Standard A discharge limits for industrial effluent in Kuching?
Under the Environmental Quality (Industrial Effluent) Regulations 2009 Fifth Schedule, Standard A for most industries is COD ≤ 80 mg/L, suspended solids ≤ 50 mg/L, and BOD₅ ≤ 20 mg/L at 20 °C. Earlier briefs often quoted COD ≤ 50 mg/L and TSS ≤ 20 mg/L as internal targets. Confirm the exact schedule on your DOE license, including sector-specific COD rows where they apply.
What CAPEX should a 200 m³/day MBR plant expect in Kuching?
A 200 m³/day MBR plant in Kuching typically budgets RM 2.4 million to RM 3.0 million CAPEX, based on RM 12,000–RM 15,000 per m³/day of capacity. OPEX is usually RM 1.50–RM 2.10/m³ when energy and membrane cleaning are included. Peak flow should be sized near 1.5× average daily flow for monsoon months.
How does land scarcity change technology choice in Pending and Demak Laut?
Land scarcity in Pending and Demak Laut favors compact MBR footprints of 0.5–1.0 m²/m³/day over larger conventional aeration basins. DAF at 0.2–0.4 m²/m³/day remains useful as pretreatment when FOG or TSS is high. Central sewer connections help domestic PE load, but industrial COD and metals still need on-site control before discharge.
How long does DOE permitting usually take in Sarawak?
Pretreatment approval commonly takes 6–12 months when sampling and drawings are complete. An EIA, when required for larger capacities, often adds 3–6 months and RM 100K–RM 300K. Incomplete heavy-metal data for electronics plants is a frequent cause of review delays and redraw cycles.
Is DAF enough alone for palm oil effluent in Sarawak?
DAF alone is rarely enough for palm oil effluent with COD of 2,500–6,000 mg/L. DAF can remove 90–95% of TSS and FOG, but residual organics usually need anaerobic digestion or MBR polishing to hold Standard A or the licensed sector limits. Hybrid DAF + MBR trains are the common compliance path for these loads in Sarawak mills.