Municipal Sewage Treatment Plants in Queensland 2026: Engineering Specs, Cost Models & Zero-Risk Compliance Blueprint
Engineering Solutions & Case Studies
Zhongsheng Engineering Team
Municipal Sewage Treatment Plants in Queensland 2026: Engineering Specs, Cost Models & Zero-Risk Compliance Blueprint
Queensland’s municipal sewage treatment plants must achieve EPA Class C effluent (BOD ≤ 20 mg/L, TSS ≤ 30 mg/L) while handling variable loads from decentralized growth hubs like the Sunshine Coast and Townsville. In 2026, MBR systems dominate for high-efficiency applications (99% TSS removal, 60% smaller footprint), but ASBR+ systems offer cost-effective nutrient removal for domestic sewage. CAPEX ranges from AUD 5M for 2,000 m³/day plants to AUD 250M for 100,000 m³/day facilities, with energy costs averaging 0.4–0.8 kWh/m³ for MBR and 0.2–0.5 kWh/m³ for conventional systems.
Queensland’s Municipal Sewage Treatment Challenges: Climate, Load Variability & Compliance
Queensland's decentralized population growth, exemplified by regions like the Sunshine Coast (+3.2% YoY) and Townsville (+2.8% YoY), significantly strains existing centralized municipal sewage treatment plant infrastructure. This demographic shift, particularly towards regional hubs, necessitates adaptable and efficient wastewater treatment solutions, often leveraging package plants to bridge infrastructure gaps (industry analysis, 2025). Climatic extremes further complicate municipal sewage plant design. The cyclone-prone northern regions, such as Cairns, demand robust, flood-resistant designs capable of withstanding extreme weather events. Conversely, arid western areas like Mount Isa face severe water scarcity, making water reuse systems with a minimum of 30% recovery rates for inland plants an economic and environmental imperative.
All municipal discharges in Queensland are subject to the Environmental Protection Agency (EPA) Class C effluent standards, mandating BOD ≤ 20 mg/L and TSS ≤ 30 mg/L. For projects aiming for water reclamation, such as irrigation or industrial use, stricter Class A standards (BOD ≤ 5 mg/L) apply (per EPA guidelines, 2024). Influent load variability presents another significant operational challenge for municipal sewage treatment plants. Tourist resorts on the Gold Coast, for instance, can experience seasonal swings of 50–200% in daily flow, while mining camps in the Bowen Basin often present high total dissolved solids (TDS) exceeding 1,500 mg/L, which can inhibit biological treatment processes and necessitate specialized pre-treatment. Addressing these diverse challenges requires a tailored approach to municipal sewage treatment plant design and technology selection.
Challenge Category
Specific Queensland Context
Design/Operational Implication
Population Growth
Decentralized growth (Sunshine Coast +3.2% YoY)
Increased demand for modular or expandable package plants.
Demands flexible systems with adequate hydraulic and organic buffer capacity.
Influent Quality
Mining camps (Bowen Basin) TDS > 1,500 mg/L
Challenges for biological systems, may require pre-treatment or specialized membranes.
Process Comparison: MBR vs. ASBR vs. Conventional Systems for Queensland Municipal Plants
municipal sewage treatment plant in queensland australia - Process Comparison: MBR vs. ASBR vs. Conventional Systems for Queensland Municipal Plants
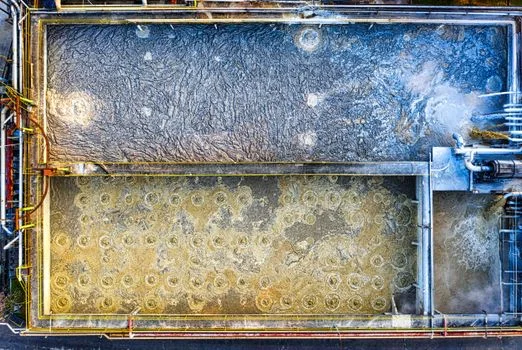
Selecting the optimal municipal sewage treatment plant technology in Queensland hinges on balancing effluent quality, footprint, and energy consumption against diverse operational demands. Each primary technology offers distinct advantages and trade-offs crucial for effective municipal sewage plant design.
Membrane Bioreactor (MBR) Systems: MBR technology integrates biological treatment with membrane filtration, typically utilizing submerged polyvinylidene fluoride (PVDF) membranes with a 0.1 μm pore size. This configuration allows for a high mixed liquor suspended solids (MLSS) concentration, ranging from 8,000–12,000 mg/L, enabling a compact footprint. MBR systems operate with a hydraulic retention time (HRT) of 4–6 hours and a sludge retention time (SRT) of 20–30 days. The resulting effluent quality is exceptionally high, with TSS consistently below 1 mg/L and COD typically under 30 mg/L (industry analysis, 2025), making them ideal for high-efficiency applications and direct reuse. For advanced municipal sewage treatment in Queensland, MBR systems offer superior performance and a smaller physical footprint.
Anoxic Sequencing Batch Reactor (ASBR) Systems: ASBR systems are a variant of SBR technology designed for enhanced nutrient removal, making them a cost-effective choice for domestic sewage. They operate in a four-phase cycle: fill, react (anoxic/aerobic), settle, and decant. ASBRs typically require an HRT of 8–12 hours and an SRT of 15–25 days. Effluent quality from ASBRs generally meets EPA Class C standards, with TSS between 10–20 mg/L and total nitrogen (TN) often below 10 mg/L (Zhongsheng field data, 2025). Their modular tank configurations allow for flexibility and a footprint approximately 30% smaller than conventional A/O systems.
Conventional Activated Sludge (A/O) Systems: Conventional activated sludge systems, often configured as Anoxic/Oxic (A/O) for basic nutrient removal, represent the most established technology. This two-stage process typically requires an HRT of 12–24 hours and an SRT of 10–20 days. While effective in meeting EPA Class C standards, with effluent TSS ranging from 20–30 mg/L and BOD between 10–20 mg/L, they demand the largest footprint.
Energy Consumption and Footprint: Energy consumption is a critical factor for long-term operational costs. MBR systems generally consume 0.4–0.8 kWh/m³ due to aeration and membrane scouring. ASBR systems are more energy-efficient at 0.3–0.6 kWh/m³, while conventional A/O systems are the least energy-intensive, averaging 0.2–0.5 kWh/m³. In terms of space, MBR systems boast a footprint approximately 60% smaller than conventional A/O plants (industry analysis, 2025), making them advantageous for urban or land-constrained projects. Zhongsheng Environmental offers advanced MBR systems for municipal sewage treatment in Queensland, integrating high performance with efficiency.
Parameter
MBR (Membrane Bioreactor)
ASBR (Anoxic SBR)
Conventional A/O
Typical MLSS (mg/L)
8,000–12,000
3,000–5,000
2,500–4,000
Hydraulic Retention Time (HRT)
4–6 hours
8–12 hours
12–24 hours
Sludge Retention Time (SRT)
20–30 days
15–25 days
10–20 days
Effluent TSS
< 1 mg/L
10–20 mg/L
20–30 mg/L
Effluent BOD
< 5 mg/L
5–15 mg/L
10–20 mg/L
Effluent TN
< 10 mg/L (with specific design)
< 10 mg/L
15–30 mg/L
Energy Consumption (kWh/m³)
0.4–0.8
0.3–0.6
0.2–0.5
Footprint (Relative to A/O)
40% (60% smaller)
70% (30% smaller)
100%
2026 Cost Models: CAPEX, OPEX & Energy Benchmarks for Queensland Municipal Plants
Accurate budgetary planning for a municipal sewage treatment plant in Queensland requires detailed CAPEX, OPEX, and energy benchmarks that reflect current market conditions and technological choices. These cost models are crucial for procurement managers evaluating proposals and justifying significant infrastructure investments.
Capital Expenditure (CAPEX): The initial capital outlay for municipal sewage treatment plants varies significantly with capacity and technology. For a 5,000 m³/day facility, CAPEX can range from AUD 5M for conventional A/O systems, increasing to AUD 8M for ASBR, and up to AUD 12M for MBR technology (Zhongsheng project data, 2025). Larger facilities, such as a 100,000 m³/day plant, can command CAPEX upwards of AUD 250M. These figures include civil works, equipment procurement, installation, and commissioning.
Operational Expenditure (OPEX): Recurring operational costs are primarily driven by energy, labor, chemicals, and maintenance. MBR systems typically incur higher OPEX at AUD 0.40–0.70/m³, largely due to membrane replacement schedules (every 5–8 years) and specialized cleaning chemicals. ASBR systems are more cost-effective with OPEX ranging from AUD 0.25–0.50/m³, while conventional A/O systems fall between AUD 0.20–0.40/m³ (Zhongsheng project data, 2025). Labor costs account for 20-30% of total OPEX, depending on automation levels.
Energy Costs: Energy is a dominant component of OPEX. Using Queensland's average industrial electricity rate of AUD 0.25/kWh, an MBR plant consuming 0.4–0.8 kWh/m³ will incur AUD 0.10–0.20/m³ in energy costs. A conventional A/O plant, with its lower energy consumption of 0.2–0.5 kWh/m³, will see energy costs of AUD 0.05–0.13/m³. This difference highlights the long-term financial implications of technology selection.
Sludge Disposal: Sludge management is a significant cost. Dewatered sludge disposal typically ranges from AUD 150–300/tonne in Queensland. The choice between dewatering technologies, such as a plate-and-frame filter press for sludge dewatering in Queensland municipal plants or a centrifuge, impacts both CAPEX and the dryness of the final cake, directly influencing disposal volumes and costs.
Return on Investment (ROI) Drivers: Beyond basic treatment, revenue streams can offset costs. Water reuse, particularly in arid regions, can generate savings of AUD 2.50/m³ by reducing reliance on potable water. Nutrient recovery, such as struvite precipitation from phosphorus-rich sludge, can yield AUD 50–100/tonne in revenue, transforming waste into a valuable resource and contributing to the overall sustainability of the municipal sewage treatment plant.
municipal sewage treatment plant in queensland australia - EPA Queensland Compliance: Permitting, Monitoring & Zero-Risk Discharge Framework
Adherence to Queensland's Environmental Protection Act 1994 (2024 amendments) is paramount for municipal sewage treatment plants, with corporate penalties for non-compliance reaching AUD 1.1 million per incident and individual liability up to AUD 220K or 2 years imprisonment (industry analysis, 2025). This stringent regulatory environment necessitates a zero-risk discharge framework for all municipal sewage treatment plant operations.
The Environmental Protection Policies (EPP) define specific effluent quality criteria. For general discharge, EPA Class C standards apply: BOD ≤ 20 mg/L, TSS ≤ 30 mg/L, pH between 6–9, and E. coli < 1,000 CFU/100mL. For treated wastewater intended for reuse, Class A standards are significantly stricter, requiring BOD ≤ 5 mg/L and TSS ≤ 5 mg/L. Understanding these Queensland wastewater treatment regulations is fundamental to plant design and operation.
The permitting process for a new municipal sewage treatment plant typically spans 6–12 months. This includes detailed environmental impact assessments (EIS) for facilities exceeding 10,000 m³/day capacity, demonstrating how the plant will meet compliance requirements and mitigate environmental risks. The permit specifies numerous monitoring points and reporting frequencies (Queensland Government, 2024).
Real-time monitoring is a mandatory component of compliance for municipal sewage treatment plants. Key parameters such as pH, dissolved oxygen (DO), turbidity, and flow rate must be continuously monitored, with data transmitted via telemetry to regulatory bodies. This enables immediate detection of excursions and rapid corrective action, preventing environmental harm and avoiding penalties. Regular calibration and maintenance of these sensors are crucial for data accuracy.
Audit requirements reinforce compliance. Plants exceeding 5,000 m³/day capacity must undergo annual third-party environmental audits. Smaller plants are typically subject to quarterly self-audits. Common audit findings include inadequate sludge wasting records, real-time monitoring failures, and effluent TSS exceeding 30 mg/L. Corrective actions often involve operational adjustments, such as increasing SRT to 20 days for improved sludge settling or implementing more rigorous sensor calibration schedules.
Parameter
EPA Class C Standard (Discharge)
EPA Class A Standard (Reuse)
Real-Time Monitoring Sensor Type
Typical Accuracy Range
BOD
≤ 20 mg/L
≤ 5 mg/L
N/A (Lab Test)
± 1 mg/L
TSS
≤ 30 mg/L
≤ 5 mg/L
Turbidity (proxy)
± 2% FS
pH
6–9
6–9
pH electrode
± 0.02 pH
E. coli
< 1,000 CFU/100mL
< 1 CFU/100mL
N/A (Lab Test)
± 10%
Dissolved Oxygen (DO)
N/A (Internal Process)
N/A (Internal Process)
Optical DO sensor
± 0.1 mg/L
Flow Rate
Continuous Record
Continuous Record
Ultrasonic/Magnetic Flow Meter
± 1% of reading
Turbidity
N/A (Monitoring)
N/A (Monitoring)
Nephelometric Turbidimeter
± 2% FS
Supplier Selection Framework: Turnkey vs. Modular, Local Service & Compliance Guarantees
A robust supplier selection framework is critical for Queensland municipal sewage treatment plant projects to mitigate risks, ensure compliance, and secure long-term operational reliability. Procurement managers must carefully weigh various factors beyond initial cost to ensure project success.
Turnkey vs. Modular Solutions: Suppliers typically offer either turnkey or modular systems. Turnkey solutions provide single-point accountability, simplifying project management and often leading to faster deployment. However, they can be more expensive and offer less flexibility for future expansion or modifications. Modular systems, conversely, allow for greater scalability and phased investment, reducing initial CAPEX. The trade-off is increased coordination risk between multiple suppliers and potentially longer overall project timelines. For decentralized sewage treatment in Queensland, modular package plants can offer significant advantages.
Local Service Networks: The availability of local service and support is paramount for the continuous operation of a municipal sewage treatment plant. While some suppliers are Queensland-based, international manufacturers like Zhongsheng Environmental partner with local service providers to ensure prompt response times, technical support, and spare parts availability. Evaluating a supplier's local service network, including their ability to respond within 24–48 hours for critical issues and maintain a local inventory of essential spare parts, is crucial. This proactive approach minimizes downtime and ensures the longevity of the plant, as detailed in our Queensland supplier selection framework.
Compliance Guarantees: Reputable suppliers offer clear compliance guarantees, often backed by performance bonds (typically 10% of the contract value) and liquidated damages clauses for non-compliance or missed project deadlines (e.g., AUD 10,000/day). These guarantees provide financial protection and incentivize the supplier to meet agreed-upon effluent standards and project timelines. Scrutiny of these clauses is vital during contract negotiation.
Evaluation Criteria: A structured evaluation process helps objectively compare suppliers. A weighted scoring system can prioritize key factors: technical compliance (30%), overall cost (25%), local service and support (20%), compliance guarantees (15%), and sustainability initiatives (10%). This comprehensive approach ensures that all critical aspects of the project are considered.
Red Flags: Procurement managers should be wary of red flags that indicate potential risks. These include vague performance guarantees, a lack of verifiable Queensland project references, and no readily available local spare parts inventory. Long lead times, which average 12–16 weeks for custom designs (industry analysis, 2025), should also be factored into the project schedule.
Evaluation Criteria
Weighting (%)
Key Considerations
Technical Compliance
30%
Ability to meet EPA Class C/A, process stability, effluent quality guarantees.
Overall Cost (CAPEX/OPEX)
25%
Total cost of ownership, transparent pricing, lifecycle cost analysis.
Local Service & Support
20%
Response times, spare parts availability, local technical expertise.
Relevant Queensland projects, client testimonials, operational history.
Sustainability & Innovation
5%
Energy efficiency, water reuse, nutrient recovery, future-proofing.
Frequently Asked Questions
municipal sewage treatment plant in queensland australia - Frequently Asked Questions
Addressing common inquiries about municipal sewage treatment plants in Queensland helps engineers and planners make informed decisions regarding technology, costs, and compliance.
What are the key differences between MBR and ASBR for Queensland municipal plants?
MBR systems offer superior effluent quality (TSS < 1 mg/L) and a significantly smaller footprint (60% smaller than conventional A/O), making them ideal for high-efficiency applications or land-constrained sites. However, they require more energy and have a higher CAPEX and OPEX due to membrane replacement. ASBR systems are more cost-effective for nutrient removal (TN < 10 mg/L) and have lower energy consumption, but result in higher sludge production and a larger footprint than MBR.
How much does a 10,000 m³/day municipal sewage treatment plant cost in Queensland?
A 10,000 m³/day municipal sewage treatment plant in Queensland typically has a CAPEX ranging from AUD 20M to AUD 40M, depending on the chosen technology. MBR systems would be at the higher end of this range, while conventional A/O systems would be at the lower end. OPEX for such a plant generally falls between AUD 0.25–0.70/m³, encompassing energy, chemicals, labor, and maintenance.
What are the most common compliance issues for Queensland municipal plants?
The most common compliance issues for municipal sewage treatment plants in Queensland include inadequate sludge wasting records leading to poor sludge quality, failures in real-time monitoring equipment resulting in data gaps, and effluent total suspended solids (TSS) consistently exceeding the 30 mg/L EPA Class C limit. Corrective actions often involve operational adjustments, such as increasing the sludge retention time (SRT) to 20 days for better sludge settling or implementing more rigorous sensor calibration and maintenance schedules.
Can package plants meet EPA Class C standards for municipal sewage?
Yes, modular package plants can meet EPA Class C standards for municipal sewage, particularly for flows less than 5,000 m³/day, making them suitable for decentralized growth hubs or remote communities. The WSZ Series underground package plants for remote Queensland municipalities, for example, are designed for flows from 1–80 m³/h. However, their limitations include challenges with highly variable influent loads or influent with high TDS or industrial components, which may require specialized pre-treatment or larger, customized designs.
What are the energy costs for a 5,000 m³/day MBR plant in Queensland?
Based on an energy consumption rate of 0.4–0.8 kWh/m³ for MBR systems and an average Queensland industrial electricity rate of AUD 0.25/kWh, the energy costs for a 5,000 m³/day MBR plant would be AUD 0.10–0.20/m³. Annually, this translates to an estimated AUD 182,500–365,000 in energy costs (5,000 m³/day * 365 days/year * 0.4-0.8 kWh/m³ * AUD 0.25/kWh). This figure highlights the need for energy-efficient design and operation to manage the overall Queensland sewage treatment CAPEX and OPEX.
Our team of wastewater treatment engineers has over 15 years of experience designing and manufacturing DAF systems, MBR bioreactors, and packaged treatment plants for clients in 30+ countries worldwide.