What Drives PAC Dosing Cost in Wastewater Treatment
Polyaluminum Chloride (PAC) — formula [AL₂(OH)ₙCL₆₋ₙ]ₘ, commercial grade typically 10–30% Al₂O₃ — is the workhorse coagulant for municipal and industrial clarification because it works across a broad pH band and produces less alkalinity consumption than ferric chloride. The full cost of running PAC, however, is not the line-item price on the bulk-bag invoice. Two cost drivers compound: chemical unit price (USD per kg of active Al₂O₃) and dose rate (mg/L applied per m³ treated). A 2025–2026 commodity listing for powdered aluminium chlorohydrate from Zhengzhou Wade sits at US $265–305 per metric ton FOB China at 500-tonne minimum order (per TradeSNS, 2025), which translates to roughly $0.88–1.02 per kg of product as the baseline figure for any optimization calculation.
The hidden cost driver that breaks most "we just need cheaper PAC" arguments is overdosed sludge. Every 1 mg/L of PAC that goes beyond the optimum contributes roughly 0.3–0.5 mg/L of additional dry sludge solids. With 2026 sludge disposal in the $40–130/ton range across the US, EU, and China, the chemical line item is usually smaller than the disposal line item for an over-dosed plant. The optimization problem, written out, is: minimize (PAC dose × $/kg) + (incremental sludge mass × $/ton disposal) subject to effluent TSS, COD, and residual Al constraints. If your plant has not measured the sludge penalty, you are optimizing only the visible 30–50% of the total cost.
Typical PAC Dose Ranges by Influent Type
Before launching a jar test, a plant engineer needs a starting reference band to know whether the current dose is suspiciously high or already near optimum. The table below compiles industry-typical PAC dose ranges by influent class — these are engineering rule-of-thumb ranges, not regulatory values, and every site will land at its own point inside the band.
| Influent Type | Typical PAC Dose (mg/L) | Effective pH Window | Critical Constraint |
|---|---|---|---|
| Municipal raw wastewater (primary/secondary) | 5–30 | 6.5–7.8 | Effluent TSS < 30 mg/L (typical permit) |
| High-TSS industrial (food, slaughterhouse, paper) | 50–150 | 6.5–8.0 | COD removal > 60% |
| Textile / dyeing wastewater | 100–300 | 6.0–8.5 | Color removal > 80% |
| High-color surface water (drinking-water intake) | 20–80 | 6.5–7.5 | Residual Al < 0.1–0.2 mg/L (WHO) |
| Landfill leachate | 150–400 | 5.5–7.5 | COD > 50% removal + FOG capture |
pH control is non-negotiable: PAC hydrolyzes poorly outside pH 6.0–8.5, so a plant running at pH 5 or pH 9 will see its effective dose roughly double without any change in influent. On the compliance side, the WHO drinking-water guideline for residual aluminum is 0.1–0.2 mg/L, and many industrial discharge permits sit at 2–5 mg/L Al in the effluent — chronic over-dosing pushes you straight into the non-compliance band. Temperature also matters: below 10 °C floc kinetics slow markedly, and winter operation typically requires a 10–25% dose increase to hit the same supernatant quality. That seasonal swing alone is worth quantifying on a 12-month consumption chart before any control upgrade.
The Jar Test Protocol: Finding the Minimum Effective Dose
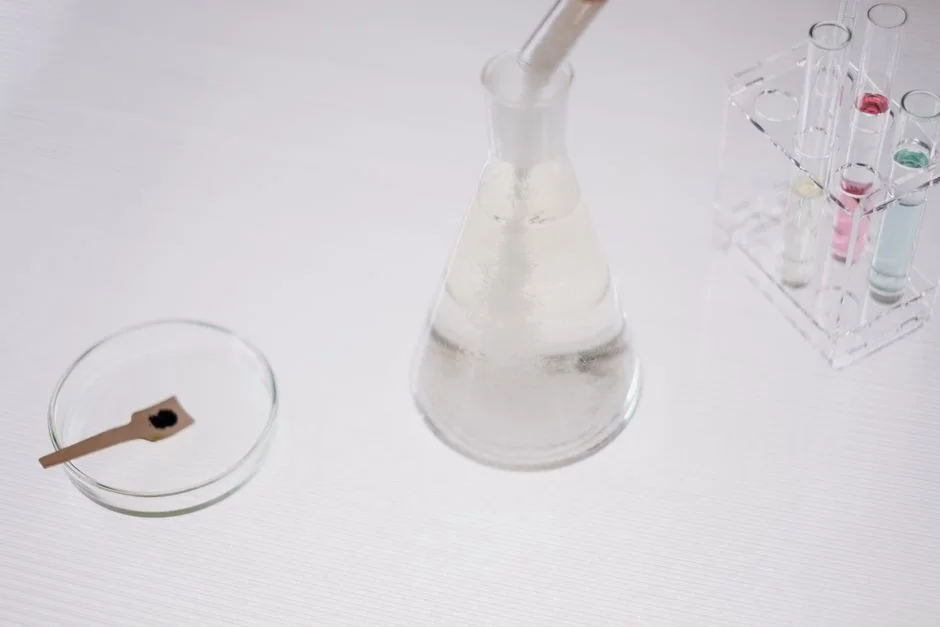
The single highest-leverage optimization step any plant can take is a properly designed jar test, run on at least three distinct influent "modes" — not a single grab sample on a Tuesday morning. A repeatable protocol the operator can run on Monday looks like this:
- Collect 6 × 1 L representative influent samples in standard jar-test beakers.
- Dose gradient covering your expected range — for a textile plant currently running 200 mg/L, test 50, 100, 150, 200, 250, 300 mg/L.
- Rapid mix at 200 rpm for 1 minute to disperse coagulant and neutralize colloid charge.
- Slow mix at 30 rpm for 20 minutes to allow floc growth.
- Settle 30 minutes, then pull supernatant from 2 cm below the surface for TSS, turbidity, and residual Al measurement.
- Record sludge volume (mL) in each beaker — this is the often-skipped data point that links dose to downstream disposal cost.
At the optimum, measure ζ-potential or streaming current on the supernatant; that single value becomes the setpoint for any online controller you install later. Plot supernatant TSS (left axis) and sludge volume (right axis) versus dose — the optimum sits at the "knee" where supernatant quality plateaus but sludge volume has not yet ramped up. Single-point jar tests on grab samples systematically under-dose the real operating envelope, which is why the three-mode protocol (dry-weather, first-flush, post-storm or high-COD batch) is the minimum engineering standard. For plants looking to automate the procedure, an automatic chemical dosing system with jar-test data logging shortens the cycle from weeks to days and creates the training dataset a streaming-current or AI controller needs.
Dosing-Control Technologies Compared
Once the jar test defines the target dose, the next question is what level of control is worth the capex. The four architectures below cover the entire 2026 industrial range, from no automation to AI-driven neural networks. The 49% chemical-cost reduction documented in the Ecuadorian drinking-water study (Computation 13, 00179, 2026) used a hybrid ANN–GA controller trained on six months of historical jar and process data — that result is reproducible on industrial plants with similar data history, not only on drinking-water skids.
| Architecture | Capex (USD, installed) | Typical PAC Saving | Best-Fit Plant Size | Skill Requirement | Payback |
|---|---|---|---|---|---|
| Manual / timed dosing | $200–800 | 0% (baseline) | < 20 m³/h, stable influent | Operator rounds | N/A |
| Flow-proportional (mag-meter + VFD pump) | $2,500–6,000 | 30–40% | 20–500 m³/h | Instrumentation tech | 2–6 months |
| Streaming current / ζ-potential feedback | $8,000–15,000 | 20–35% | 50–5,000 m³/h | Process engineer + sensor maintenance | 6–14 months |
| AI / ANN–GA control | $18,000–45,000 | 40–49% | > 200 m³/h, variable influent | Data engineer + process engineer | 10–20 months |
Flow-proportional control is the 2026 mainstream default for mid-sized industrial plants because it cuts overdosing by roughly a third with a payback under six months and minimal operator skill. AI control is justifiable on larger or highly variable plants where the variance reduction itself (not just the mean) drives chemical savings — narrower day-to-day distribution means less safety margin has to be dialed in. For readers building a business case, the AI dosing control case studies post lays out the data-engineering prerequisites in detail.
Sludge, Compliance, and the Hidden 15–30% Cost Penalty
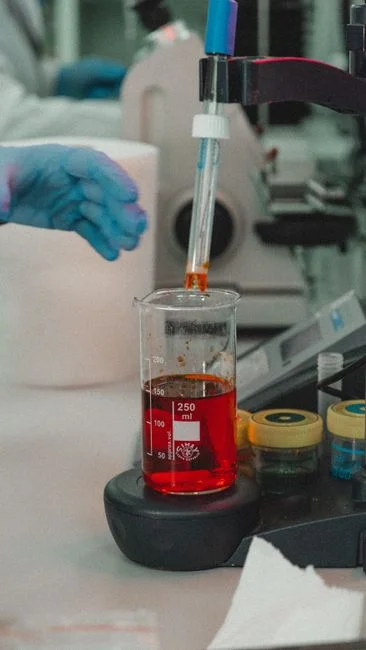
Every 10 mg/L of excess PAC above optimum adds roughly 3–5 mg/L of dry sludge solids; on a 1,000 m³/d plant, that is 30–50 kg/d of extra cake at 20% dryness. At the 2026 disposal cost band of $40–130/ton (see the 2026 sludge disposal cost data breakdown), 30–50 kg/d of extra cake translates to $1.20–6.50 per day in avoidable disposal — annualizing to $440–2,400, which frequently exceeds the chemical savings from a "cheaper PAC" sourcing project. On a larger 10,000 m³/d plant the same arithmetic produces a six-figure annual penalty, which is why no optimization case is complete without quantifying the sludge line.
Residual aluminum is the other silent risk: chronic over-dosing pushes effluent Al above the 2–5 mg/L permit band typical for industrial discharge, and the fines for non-compliance dwarf any chemical saving on the purchase order. Upstream, a well-tuned dose also makes the dewatering step downstream run better — drier cake out of a plate-frame filter press cuts polymer consumption on sludge conditioning, compounding the saving. A lamella clarifier with sludge recirculation further reduces coagulant demand by up to 30% compared to conventional settling, because the recirculated solids act as ballast nuclei for floc formation.
A 2026 ROI Framework for PAC Dosing Optimization
A defensible internal case to a CFO follows five steps and ends in a payback figure the finance team can sign off on. Worked example below assumes a 200 m³/d textile plant currently dosing 250 mg/L PAC at $0.95/kg, with 4.2 t/d of wet cake disposed at $80/ton.
- Baseline. PAC consumption = 200 m³/d × 250 mg/L × 0.001 = 50 kg/d. Coagulant OPEX = 50 × $0.95 × 365 = $17,338/yr.
- Project dose reduction. Conservative: 20% from jar test + flow-proportional; 35% with full feedback control; 40–49% with AI control (per the Ecuador 2026 case study).
- Add avoided sludge-disposal cost. Conservatively estimate 15% reduction in current disposal $/d as the penalty reduction.
- Subtract new control opex. Sensor maintenance, calibration, and consumables at 3–5% of capex per year.
- Compute payback. Savings ÷ net capex = months to break even.
| Stage | PAC Dose (mg/L) | Annual PAC Spend (USD) | Sludge Disposal (USD/yr) | Control Capex (USD) | Net Annual Saving (USD) | Payback (months) |
|---|---|---|---|---|---|---|
| Baseline (manual dosing) | 250 | $17,338 | $122,640 | $0 | — | — |
| After jar test + flow-proportional | 200 | $13,870 | $104,244 | $4,500 | $21,864 | 2.5 |
| Add streaming-current feedback | 163 | $11,302 | $96,686 | $11,500 | $31,990 | 4.3 |
| Upgrade to AI / ANN–GA | 128 | $8,876 | $90,110 | $32,000 | $40,992 | 9.4 |
The savings waterfall makes the executive story obvious: even the modest jar-test-plus-flow-proportional stage returns capex in under three months, and the AI upgrade — while heavier on data-engineering hours — pushes annual savings past $40k on a 200 m³/d plant. Larger plants scale roughly linearly on chemical savings and super-linearly on sludge savings, because the absolute mass of avoided cake grows with flow.
Frequently Asked Questions
What is the minimum effective PAC dose for municipal wastewater? Industry-typical municipal raw wastewater requires 5–30 mg/L PAC at pH 6.5–7.8 to reach effluent TSS below 30 mg/L; jar testing on three influent modes is the only way to find the true minimum for a specific plant.
How much does overdosing PAC increase sludge volume? Every 1 mg/L of excess PAC contributes roughly 0.3–0.5 mg/L of additional dry sludge solids, which on a 1,000 m³/d plant at 20% dryness is 30–50 kg/d of extra cake — frequently a larger annual cost than the chemical saving.
What is the typical residual aluminum limit in industrial discharge? Most industrial discharge permits set effluent total aluminum at 2–5 mg/L, compared to the WHO drinking-water guideline of 0.1–0.2 mg/L; chronic over-dosing pushes plants straight into the non-compliance band.
Which dosing-control architecture gives the fastest payback in 2026? Flow-proportional dosing using a magnetic flowmeter and variable-speed pump typically pays back in 2–6 months at 30–40% chemical savings; full feedback control with a streaming-current sensor extends savings to 20–35% with a 6–14 month payback on mid-sized plants.
Can AI dosing control be retrofitted to an existing plant? Yes — the Ecuador 2026 ANN–GA study (Computation 13, 00179) achieved a 49% median chemical-cost reduction using six months of historical jar and SCM data; the same approach is documented in AI dosing control case studies for industrial installations using an automatic chemical dosing system with data logging.
Does a lamella clarifier reduce PAC demand? Sludge-recirculation lamella designs reduce coagulant demand by up to 30% versus conventional settling because recirculated solids act as floc nuclei; pairing a high-efficiency sedimentation tank with a tuned dose compounds the savings.