What Makes Plywood Wastewater Different
A plywood line produces three wastewater streams that a single biological reactor cannot handle without pretreatment: log conditioning and debarker water, glue-blend and resin tank washout, and hot-press condensate. Each carries a different COD load, solids profile, and temperature, and they mix unpredictably across an 8–16 hour shift. Plywood glue lines based on phenolic-formaldehyde (PF) or urea-melamine-formaldehyde (UMF) drive the highest organic load: typical mixed influent runs 8,000–25,000 mg/L COD, with BOD/COD ratios of only 0.15–0.25 because much of the carbon is in resin-bound and slowly biodegradable form, and TSS of 1,500–6,000 mg/L from wood fiber carryover. pH lands at 4–6, and the hot-press discharge often pushes mixed temperature to 45–65 °C, which is well above the 35 °C ceiling for uncooled activated sludge.
Legacy designs such as the 80,000-gallon, 10-day-detention aerobic pond documented in the 1970s Plywood Corporation reference were sized for a 8,000 gal/day (≈30 m³/day) flow and depended on long residence time, open surface, and natural phenolic off-gassing. In 2026 those ponds fail three ways: they cannot meet the tightened GB 3544-2008 phenolics limit of 0.5 mg/L or the EU Industrial Emissions Directive 2010/75/EU BAT-AEL COD range of 20–80 mg/L, they emit odor and phenol vapor that triggers community complaints, and they consume 10–20× the footprint of a modern closed-tank biology train. The migration path from lagoon to closed reactor is captured in the 2026 SBR for wood processing wastewater guide, which documents 24–48 hour HRT designs as the new baseline for wood-based panel plants.
Plywood Wastewater Influent Characteristics in 2026
Influent characterization drives every downstream equipment choice. The table below consolidates 2026 operating data from wood-based panel plants at three flow scales: a small specialty veneer mill (50 m³/day), a mid-sized LVL or blockboard line (200 m³/day), and a large continuous-plywood facility (500 m³/day). The DAF system and MBR system sizing thresholds referenced later in the article are taken from the same 2026 equipment catalogs — DAF units cover 4–300 m³/h across 13 standard skid sizes, and MBR modules are typically quoted per 32–135 m³/day unit.
| Parameter | Small plant (50 m³/day) | Mid plant (200 m³/day) | Large plant (500 m³/day) |
|---|---|---|---|
| COD (mg/L) | 8,000–14,000 | 12,000–20,000 | 15,000–25,000 |
| BOD₅ (mg/L) | 1,500–3,000 | 2,500–4,500 | 3,500–6,000 |
| TSS (mg/L) | 1,500–3,000 | 2,500–4,500 | 3,500–6,000 |
| Phenolics (mg/L) | 50–150 | 100–300 | 150–500 |
| pH | 4.0–6.0 | 4.0–6.0 | 4.0–6.0 |
| Temperature (°C) | 35–55 | 40–60 | 45–65 |
| FOG (mg/L) | 200–500 | 300–800 | 400–1,200 |
| Flow swing (peak/avg) | 1.5–2.0× | 1.4–1.8× | 1.2–1.5× |
Seasonality matters as much as absolute values: veneer plants running green-veneer campaigns in spring and dried-veneer campaigns in autumn can see 20–40% flow swings between batches. Equalization tanks are sized for 8–24 hours of average flow, which smooths both hydraulic and thermal peaks before biology. Skipping equalization is the single most common cause of biomass washout in plywood plant SBRs (HydropureWater field data, 2026).
The 2026 Standard Process Flow: Screen → Equalize → DAF → Biological → Polish
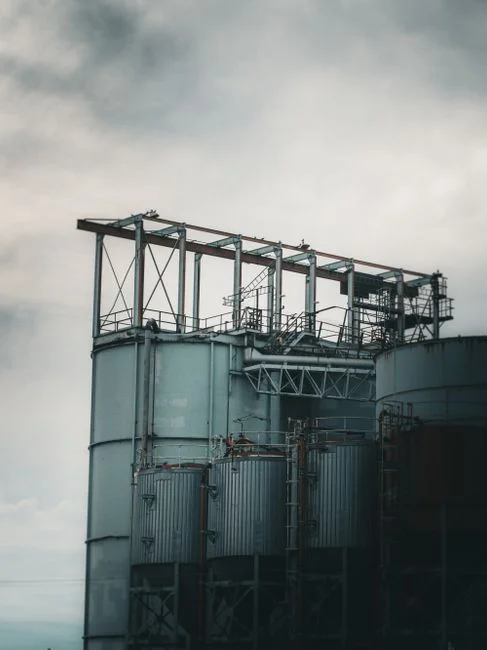
A 2026 plywood wastewater treatment system runs five sequential stages, each with a defined removal target and a defensible equipment choice. The flow sheet below is what a procurement-grade P&ID should reflect.
Stage 1 — Coarse screening. A rotary bar screen for veneer and debarker wastewater with 2–6 mm aperture protects downstream pumps from bark, offcuts, and glue rags. Screening at this aperture removes 10–25% of incoming TSS before it can blind DAF or shred aeration diffusers.
Stage 2 — Equalization. An 8–24 hour HRT equalization tank, with NaOH or lime dosing to bring pH to 6.5–7.5, and a plate heat exchanger on the inlet line if press condensate dominates the flow. Temperature control is the underrated step: a 50 °C mixed stream entering an MBR tank will lift MLSS temperature above the 38 °C membrane tolerance and accelerate fouling.
Stage 3 — Dissolved air flotation. A DAF system for plywood wastewater operating at 4–6 m³/m²/h surface loading, with 4–6 kg recycle ratio, removes 85–95% of TSS and 60–80% of FOG and emulsified phenolics. The float is skimmed automatically and sent to sludge handling. Skipping DAF in front of biology is the second most common cause of membrane fouling in wood-panel MBRs.
Stage 4 — Biological stage. SBR or MBR system for plywood wastewater, selected against discharge targets and reuse goals (see comparison table in the next section). For 2026 reuse or ZLD targets, MBR is dominant because it produces effluent COD <50 mg/L and TSS <5 mg/L in a footprint roughly 60% smaller than SBR.
Stage 5 — Polishing. Either Fenton oxidation (H₂O₂/Fe²⁺ at pH 3–3.5, H₂O₂:Fe²⁺ molar ratio 5–10:1) or granular activated carbon for residual phenolics, followed by optional RO polishing for plywood plant ZLD at recovery up to 95%. DAF float and biological waste sludge are dewatered on a filter press for plywood sludge dewatering to cake solids ≥30% DS for offsite disposal or kiln co-firing.
| Stage | Equipment | Key parameter | Removal target |
|---|---|---|---|
| 1. Screen | Rotary bar screen, 2–6 mm | Aperture 2–6 mm | 10–25% TSS |
| 2. Equalize | EQ tank + pH/temp trim | HRT 8–24 h, pH 6.5–7.5 | Smooths flow/thermal spikes |
| 3. DAF | DAF skid, 4–300 m³/h | Surface load 4–6 m³/m²/h | 85–95% TSS, 60–80% FOG/phenolics |
| 4. Biological | SBR or MBR | HRT 12–36 h | COD 80–120 (SBR) or <50 (MBR) mg/L |
| 5. Polish | Fenton / GAC / RO | RO recovery up to 95% | Phenolics <0.5 mg/L, conductivity <50 µS/cm |
| 6. Sludge | Plate-and-frame press | 1–500 m² area | Cake ≥30% DS |
SBR vs MBR vs Anaerobic: Choosing the Right Biological Step
The biological reactor is the single largest CAPEX and OPEX line on a plywood plant, and the wrong choice locks in compliance risk for 15+ years. SBR is the lowest-CAPEX option and suits plants that only need to meet discharge limits with a buffer of land. Conventional activated sludge (CAS) is rarer in new wood-panel designs because the footprint penalty is severe. MBR is the dominant 2026 choice for plants with reuse or ZLD goals, water-stressed sites, or tight effluent phenolics. Anaerobic UASB has been tried on PF-dominated streams, but the low BOD/COD ratio (0.15–0.25) means methanogenic yield is weak and the reactors are temperature-sensitive below 25 °C without heating.
The cycle design for SBR on wood-based panel wastewater is detailed in the 2026 SBR for wood processing wastewater guide: typical phases run 1–2 h fill, 16–22 h aerate, 1–2 h settle, 1 h decant, with mixed liquor suspended solids (MLSS) controlled at 4,000–6,000 mg/L. When MBR is chosen, the flat-sheet module data referenced in the DF series 0.1 µm PVDF module datasheet (32–135 m³/day per unit) is the right starting point for module count and footprint. For 2026 capex forecasting and membrane market trends, the MBR market sizing for 2026 report gives 14–18% YoY growth and price softening in the PVDF flat-sheet segment.
| Reactor | CAPEX (USD/m³/day) | HRT (hr) | Effluent COD (mg/L) | Footprint vs SBR | Best fit |
|---|---|---|---|---|---|
| Conventional AS | $60–$120 | 24–48 | 100–150 | 1.5–2.0× | Discharge only, large land bank |
| SBR | $80–$180 | 18–36 | 80–120 | 1.0× baseline | Discharge, small–mid plant |
| MBR (submerged PVDF) | $220–$420 | 12–24 | <50 | 0.4× | Reuse, ZLD, water-stressed sites |
| UASB (anaerobic) | $120–$250 | 24–48 | 200–400 (with post-polish) | 0.8× | High-temp, high-BOD/COD streams |
Meeting 2026 Discharge and Reuse Standards
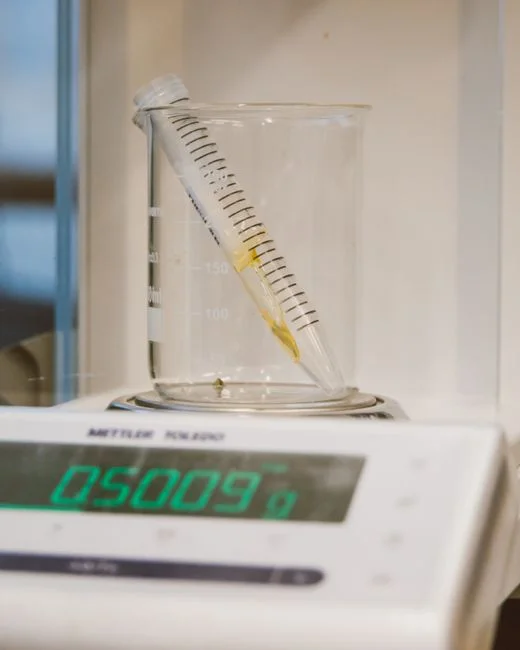
Compliance is the non-negotiable driver behind every design decision, and 2026 standards are tighter than what most existing wood-panel plants were built to meet. The China GB 3544-2008 standard for the wood-based panel industry sets COD ≤ 100 mg/L, ammonia ≤ 15 mg/L, pH 6–9, and phenolics ≤ 0.5 mg/L, with 2025/2026 tightening drafts under review in several provinces. India's Central Pollution Control Board (CPCB) sets wood-sector effluent at COD ≤ 250 mg/L and TSS ≤ 100 mg/L for inland surface discharge, with State Pollution Control Boards (SPCBs) tightening further near sensitive zones — Karnataka and Tamil Nadu commonly require COD ≤ 150 mg/L. The EU Industrial Emissions Directive 2010/75/EU BAT-AEL for wood-based panels specifies a COD range of 20–80 mg/L depending on receiving water and a phenolics limit expressed as total carbon.
When discharge is restricted — ZLD regions, water-stressed catchments, or plants with a reuse mandate — the train is extended with RO polishing and, where brine volume warrants, a brine crystallizer. Recovery of 80–95% on RO is realistic when influent TDS is held below 2,000 mg/L by the upstream biology.
| Region / standard | COD (mg/L) | TSS (mg/L) | Phenolics (mg/L) | Ammonia (mg/L) | pH |
|---|---|---|---|---|---|
| China GB 3544-2008 (current) | ≤ 100 | ≤ 30 | ≤ 0.5 | ≤ 15 | 6–9 |
| China GB 3544 (2025/2026 draft) | ≤ 80 | ≤ 20 | ≤ 0.3 | ≤ 10 | 6–9 |
| India CPCB (inland discharge) | ≤ 250 | ≤ 100 | ≤ 1.0 | ≤ 50 | 6.5–8.5 |
| EU IED 2010/75/EU BAT-AEL | 20–80 | 5–35 | ≤ 0.5 (TOC basis) | 1–10 | 6–9 |
2026 CAPEX and OPEX: What a Plywood System Actually Costs
Turning the design into a defensible 2026 budget number requires a clear break between packaged, mid-sized with MBR, and large ZLD configurations. The bands below are anchored to 2026 quotes for Asian and European equipment on a turnkey basis, with civil works, installation, and one year of commissioning spares included. OPEX is dominated by energy: 0.8–1.6 kWh/m³ for SBR, climbing to 1.5–2.8 kWh/m³ for MBR + RO trains. Chemical dosing (polymer for DAF, NaOH/lime for pH, Fenton reagents if polishing) typically adds 8–15% to the energy OPEX line, and sludge disposal is the third-largest line at $40–$80 per m³ of wet cake hauled offsite.
Over a 10-year lifecycle, MBR + RO wins decisively for plants with a reuse credit or a ZLD mandate, because the water-reuse value (typically $1.50–$4.00 per m³ of recovered water in water-stressed regions) and the compliance-risk discount offset the higher CAPEX by year 6–8. SBR-only wins on lowest CAPEX for discharge-only sites with cheap water and no ZLD exposure. Local benchmarking for the India market is captured in the 2026 wastewater treatment plant cost benchmarking article.
| System scale | Configuration | CAPEX (USD) | OPEX (USD/m³) | 10-yr fit |
|---|---|---|---|---|
| 50 m³/day small | Screen + EQ + DAF + SBR | $90K–$180K | $0.45–$0.85 | Discharge only, low-CAPEX priority |
| 200 m³/day mid | Screen + EQ + DAF + MBR | $350K–$700K | $0.70–$1.30 | Reuse or stricter discharge, mid plant |
| 500 m³/day large | Screen + EQ + DAF + MBR + RO (ZLD) | $1.5M–$3.2M | $1.10–$2.20 | ZLD mandate, large continuous plant |
Vendor Selection Checklist for a 2026 Plywood Wastewater Project
Procurement scoring should weight four dimensions in this order: process fit, compliance documentation, lifecycle support, and build-vs-buy fit. A vendor that only assembles third-party skids cannot back a 0.5 mg/L phenolic guarantee; a vendor that owns DAF, biological reactor fabrication, and membrane manufacturing in-house can. For small and mid plants, packaged integrated packaged plants shorten delivery to 8–14 weeks and are typically cheaper than site-built concrete up to roughly 200 m³/day. Above 200 m³/day, site-built concrete equalization and biology tanks become more economical on a lifecycle basis, with vendor-supplied skids handling DAF, MBR modules, RO, and the sludge press.
| Criterion | What to verify | Red flag |
|---|---|---|
| Process fit | In-house DAF + bio + membrane manufacturing; wood-panel references | Pure system integrator with no skids |
| Compliance | Effluent guarantee tied to GB 3544 / CPCB / EU IED with penalty clause | "Typical performance" with no contractual number |
| Lifecycle | Remote monitoring, spare parts ≤ 2 weeks, on-site commissioning, O&M training | One-time delivery, no service network |
| Build vs buy | Packaged plant for ≤ 200 m³/day; engineered-to-order above 200 m³/day | Packaged plant quoted above 300 m³/day |
Frequently Asked Questions
What is the best treatment for plywood wastewater?
A 2026 standard train is screen → equalization → DAF → SBR or MBR → optional Fenton or RO polish. The DAF removes 85–95% of TSS and 60–80% of FOG/phenolics before biology, which is what allows the downstream reactor to hit COD below 50 mg/L (MBR) or 80–120 mg/L (SBR) consistently.
How much does a plywood wastewater treatment plant cost in 2026?
A 50 m³/day packaged SBR plant runs $90K–$180K turnkey, a 200 m³/day MBR plant runs $350K–$700K, and a 500 m³/day MBR + RO ZLD plant runs $1.5M–$3.2M. OPEX is $0.45–$0.85/m³ for SBR, $0.70–$1.30/m³ for MBR, and $1.10–$2.20/m³ for MBR + RO.
Can MBR handle phenolic-formaldehyde resin?
Yes. Submerged 0.1 µm PVDF MBR modules achieve effluent COD below 50 mg/L and TSS below 5 mg/L on DAF-pretreated plywood wastewater, provided the upstream equalization holds temperature below 38 °C and pH at 6.5–7.5. The membrane barrier also retains slow-growing PF-degrading biomass that wash out of CAS systems.
Is zero liquid discharge possible for plywood plants?
Yes, with MBR + RO + brine crystallizer trains, but the 2026 economics work only above roughly 300 m³/day or in water-stressed regions where the reuse value offsets the ZLD CAPEX. Below that scale, side-stream RO concentrate management dominates the lifecycle cost.
What COD level can a DAF + MBR system achieve on glue wastewater?
On well-characterized glue-blend and hot-press condensate mixed at 8,000–25,000 mg/L COD influent, a DAF + MBR train with Fenton polish consistently delivers effluent COD below 50 mg/L and phenolics below 0.5 mg/L, which clears the China GB 3544-2008 limit and the EU IED BAT-AEL lower bound (per HydropureWater field data, 2026).