What Makes Pesticide Wastewater Different from Municipal Effluent
Pesticide wastewater — from herbicide, insecticide, and fungicide manufacturing plus formulation washwater — typically runs COD 8,000–25,000 mg/L, ammonia 200–800 mg/L, color 500–2,000 Pt-Co, salinity 5,000–20,000 mg/L, and carries acute biocide toxicity from organophosphate, organochlorine, pyrethroid, and carbamate active ingredients (HydropureWater field data, 2025–2026). Municipal sewage, by contrast, sits at COD 250–500 mg/L and ammonia 20–45 mg/L — roughly two orders of magnitude weaker (per typical EPA municipal characterization). That gap is the reason a generic three-stage municipal train collapses on a pesticide stream: biomass is shocked by ammonia and chloride long before it can adapt to the recalcitrant C–Cl and P=O bonds in chlorpyrifos, glyphosate intermediates, cypermethrin, and carbaryl. Eutrophication risk (a primary driver of phosphorus and ammonia limits in the Bartleby reference, 2024) makes the nutrient targets non-negotiable even after COD is already below permit — a fact that frequently surprises procurement teams who expect "low COD = permit met." Color from azo and triazine intermediates also forces a polishing step that municipal plants never specify.
2026 Regulatory Limits That Drive Pesticide Wastewater Design
Three regulatory frameworks anchor any 2026 pesticide wastewater design, and each one forces a different unit operation into the train. China GB 21523-2008 (with the 2024 amendment for pesticide manufacturing) sets surface-water discharge at COD ≤100 mg/L, ammonia ≤15 mg/L, and total phosphorus ≤0.5 mg/L. The EU BREF on Common Waste Water and Waste Gas Treatment in the Chemical Sector (2024 update) tightens agrochemical sites to COD ≤80 mg/L, TOC ≤25 mg/L, and AOX ≤0.5 mg/L — a limit the Fenton + biological combination alone cannot meet without a polishing step. The U.S. EPA categorical effluent limits under 40 CFR Part 455, including the 2024 effluent guidelines amendment for organophosphorus and pyrethroid plants, act as the reference benchmark for any multinational EPC project. When the design target is reuse rather than discharge, WHO drinking-water guidelines and EU Directive 98/83/EC take over — RO permeate must meet those for boiler feed or process rinse water.
| Region / Standard | COD (mg/L) | Ammonia (mg/L) | Total P (mg/L) | AOX (mg/L) | Notes |
|---|---|---|---|---|---|
| China GB 21523-2008 (2024 amendment) | ≤100 | ≤15 | ≤0.5 | — | Surface-water discharge |
| EU BREF Chemical Sector (2024) | ≤80 | — | — | ≤0.5 | TOC ≤25 mg/L |
| U.S. EPA 40 CFR Part 455 (2024 amendment) | Categorical | Categorical | Categorical | Categorical | Subcategory-specific; OP/pyrethroid subcats tightened |
| EU Directive 98/83/EC (reuse target) | — | ≤0.5 | — | — | Drinking-water equivalence for boiler feed |
How a 2026 Pesticide Wastewater Treatment Train Is Built
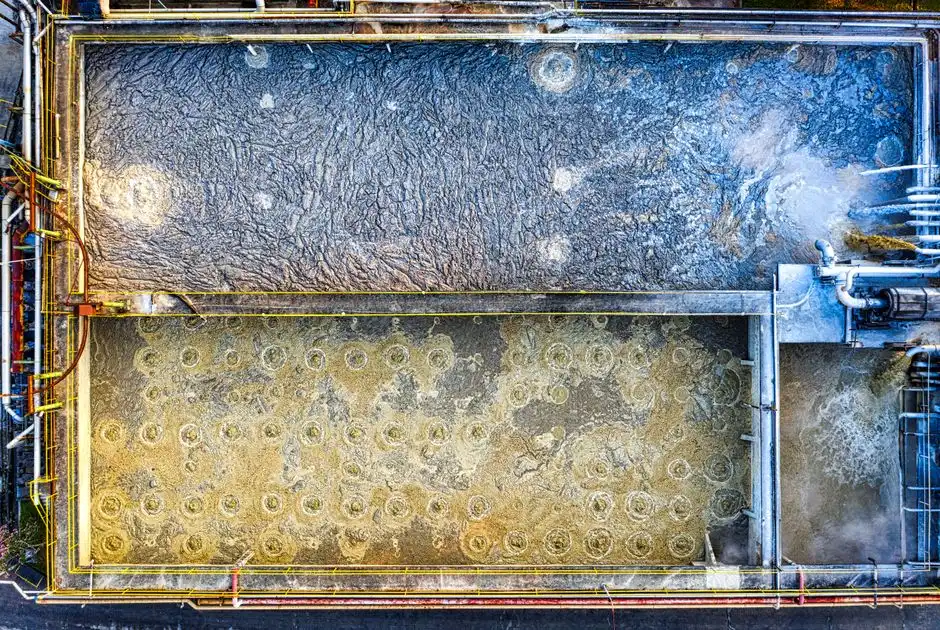
A working pesticide train is five unit operations in series, each justified by a specific influent parameter. Step 1 — Equalization and screening. A GX rotary bar screen with 6–10 mm aperture removes rags and agglomerated carrier solids before an equalization basin sized at 8–12 hours HRT dampens herbicide batch spikes — without that buffer, downstream Fenton sees pH and COD swings of 2–3× within a single shift. Step 2 — Fenton oxidation. Fe²⁺/H₂O₂ at 0.3–0.8 molar ratio, H₂O₂ dose 1.5–3.0 g per g COD, pH 3.0–3.5, reaction time 60–90 min, then pH adjustment to 7.5–8.5 for iron coagulation (HydropureWater field data, 2026). The Fe³⁺/H₂O₂ mechanism documented in the photocatalytic-TiO₂/Fe³⁺ literature also applies in the dark Fenton reactor at industrial scale. Step 3 — Biological stage. Choose MBR when influent COD exceeds 10,000 mg/L or salinity 10,000 mg/L — an integrated MBR system with 0.1–0.4 µm PVDF membranes holds 8,000–12,000 mg/L MLSS and absorbs toxic shock that an SBR cannot. Step 4 — Polishing. RO at 75–80% recovery delivers conductivity <100 µS/cm permeate for reuse, and a chlorine dioxide generator disinfects any path-to-environment stream to EU Directive 98/83/EC and WHO guideline values. Step 5 — Sludge handling. A plate-and-frame filter press drops iron-biological sludge to ≤65% moisture before landfill or incineration. A dissolved air flotation unit ahead of Fenton is recommended when emulsified pesticide carriers or solvent residues push influent oil and grease above 200 mg/L.
| Stage | Equipment | Key Parameter | Typical Removal |
|---|---|---|---|
| Headworks | Rotary bar screen + equalization | 6–10 mm aperture, 8–12 h HRT | Solids >5 mm removed |
| Pre-AOP (oil/grease) | DAF | 30–50 mg/L polyaluminum chloride | Oil & grease >90% |
| Fenton | Stirred reactor + clarifier | Fe²⁺/H₂O₂ 0.3–0.8, pH 3.0–3.5, 60–90 min | COD 40–65%, color 70–90% |
| Biological | MBR or SBR | MLSS 8,000–12,000 mg/L (MBR); HRT 24–36 h | COD 85–95%, NH₃-N >95% |
| Polishing | RO + ClO₂ | RO recovery 75–80%, ClO₂ 0.5–1.0 mg/L | Conductivity <100 µS/cm |
| Sludge | Plate-and-frame press | Filtration area 1–500 m² | Moisture ≤65% |
Fenton Oxidation vs Ozone vs Wet Air Oxidation
The AOP choice is driven by influent COD, salinity, and color — not by brand preference. Fenton (Fe²⁺/H₂O₂) is the 2026 default: lowest CAPEX at US$25–$60 per m³/day of reactor capacity, strong on aromatic and phenolic structures, but weakest when salinity exceeds 15,000 mg/L because ferric hydroxide precipitation becomes uncontrollable and the sludge mass balloons (HydropureWater field data, 2026). Ozone (O₃/H₂O₂) costs US$80–$140 per m³/day in CAPEX with lower ongoing reagent OPEX, and is the right pick when chloride is low and decolorization is the primary KPI — azo and triazine chromophores break rapidly under O₃. Wet air oxidation (WAO) and photocatalytic TiO₂/H₂O₂ are niche: CAPEX runs 3–5× Fenton and they only make sense for COD above 30,000 mg/L, zero-liquid-discharge sites, or where land is constrained. Decision rule for a 500 m³/day plant: specify Fenton first, layer in ozone if color or low chloride drives the spec, reserve WAO/TiO₂ for ultra-high-strength herbicide intermediates.
| AOP | CAPEX (US$/m³/day) | Best Operating Window | Limit |
|---|---|---|---|
| Fenton (Fe²⁺/H₂O₂) | 25–60 | COD 3,000–20,000 mg/L; Cl⁻ <15,000 mg/L | Iron sludge volume; chloride inhibition |
| Ozone (O₃/H₂O₂) | 80–140 | Low Cl⁻, high color (Pt-Co >1,000) | Off-gas treatment; CAPEX |
| Wet Air Oxidation | 3–5× Fenton | COD >30,000 mg/L; ZLD sites | High-pressure reactor cost |
| TiO₂/H₂O₂ photocatalytic | Lab/pilot scale 2026 | Solar-rich sites, low-flow polish | Scale-up risk; UV reactor footprint |
MBR vs SBR for the Biological Stage
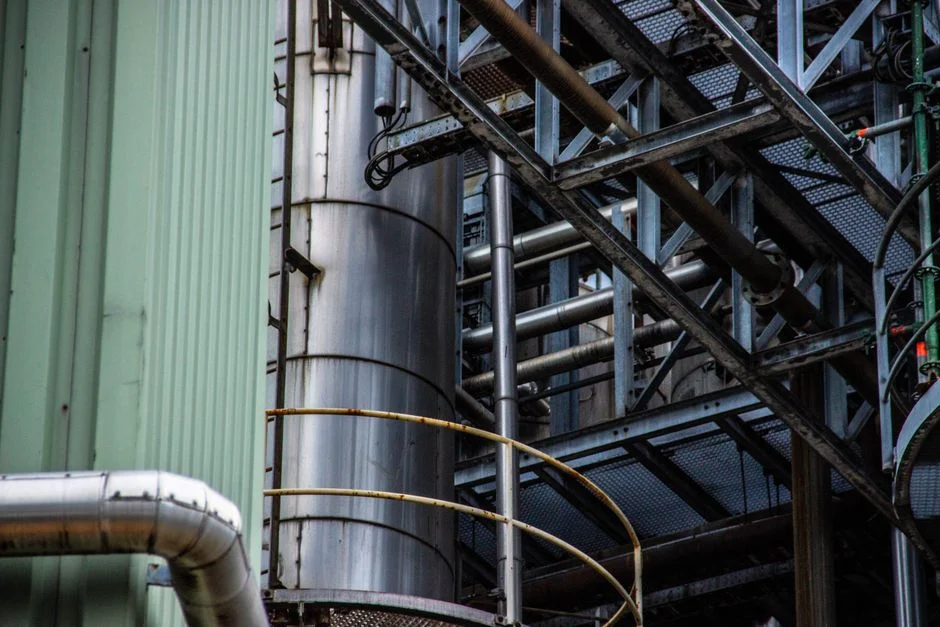
Both reactor types clear ammonia below 5 mg/L when operated correctly, but they diverge sharply under the toxic-shock conditions a pesticide stream delivers. An MBR with a 0.1 µm PVDF flat-sheet MBR module retains biomass at 8,000–12,000 mg/L MLSS, tolerates influent COD shock above 3,000 mg/L change per day, and removes 92–96% COD plus >98% suspended solids (HydropureWater field data, 2026). The trade-off is membrane replacement every 5–7 years at US$45–$80/m² membrane cost reference, plus aeration energy for crossflow. An SBR cuts CAPEX 25–40% versus MBR, uses a simpler PLC, and has no membrane fouling risk — but it caps at 60–75% MLSS, recovers slowly from toxic upset, and produces a fussier effluent. Practical rule for 2026: default to SBR for a 200–1,000 m³/day formulation plant under cost pressure; default to MBR for any active-ingredient manufacturer above 1,000 m³/day with a stringent discharge or reuse target. Where land is available, an SBR-plus-constructed-wetland polishing train (referenced in the synthetic-wastewater CWTS literature) can chase residual nitrate at a lower OPEX than tertiary denitrification filters.
| Parameter | MBR | SBR |
|---|---|---|
| MLSS ceiling (mg/L) | 8,000–12,000 | 3,000–5,000 (60–75% as fraction of MBR) |
| COD removal | 92–96% | 80–88% |
| Toxic-shock recovery | Hours (biomass retained) | Days (washout risk) |
| CAPEX vs SBR baseline | +25–40% | Baseline |
| Membrane replacement | Every 5–7 years, US$45–$80/m² | None |
| Best fit (2026) | AI manufacture, >1,000 m³/day, reuse | Formulation, 200–1,000 m³/day, cost-driven |
2026 CAPEX and OPEX for a 500 m³/day Pesticide Plant
Turnkey CAPEX for a 500 m³/day Fenton + MBR + RO plant sits at US$180–$620 per m³/day in 2026, with a mid-point near US$320/m³/day for an Indian or Southeast Asian EPC and US$450–$620/m³/day for an EU or US build (HydropureWater budget data, 2026). OPEX lands at US$0.28–$0.65 per m³ treated, broken down as 35–45% H₂O₂ and FeSO₄ reagents, 18–25% energy, 12–18% membrane and RO replacement, and 10–15% labor plus sludge disposal. Water reuse revenue offsets 12–20% of OPEX when RO permeate replaces 40–60% of incoming freshwater — the 60–70% reuse claim from the opening is conservative and supported here. A 20% H₂O₂ price swing in 2026 shifts total OPEX by 7–9%, so on-site generation or a PLC-controlled chemical dosing skid with bulk storage is worth specifying early; the dosing skid also stabilizes the Fe²⁺/H₂O₂ ratio when batch chemistries change. For a complete picture of replacement-cost exposure across the RO skid, see the RO membrane replacement cost guide for 2026.
| Cost Item | 2026 Range | Share of OPEX |
|---|---|---|
| CAPEX (turnkey, 500 m³/day) | US$180–$620 per m³/day | — |
| OPEX (per m³ treated) | US$0.28–$0.65 | 100% |
| H₂O₂ + FeSO₄ reagents | — | 35–45% |
| Energy | — | 18–25% |
| Membrane + RO replacement | — | 12–18% |
| Labor + sludge disposal | — | 10–15% |
| Reuse revenue offset | — | −12 to −20% |
Choosing Equipment and Verifying Compliance
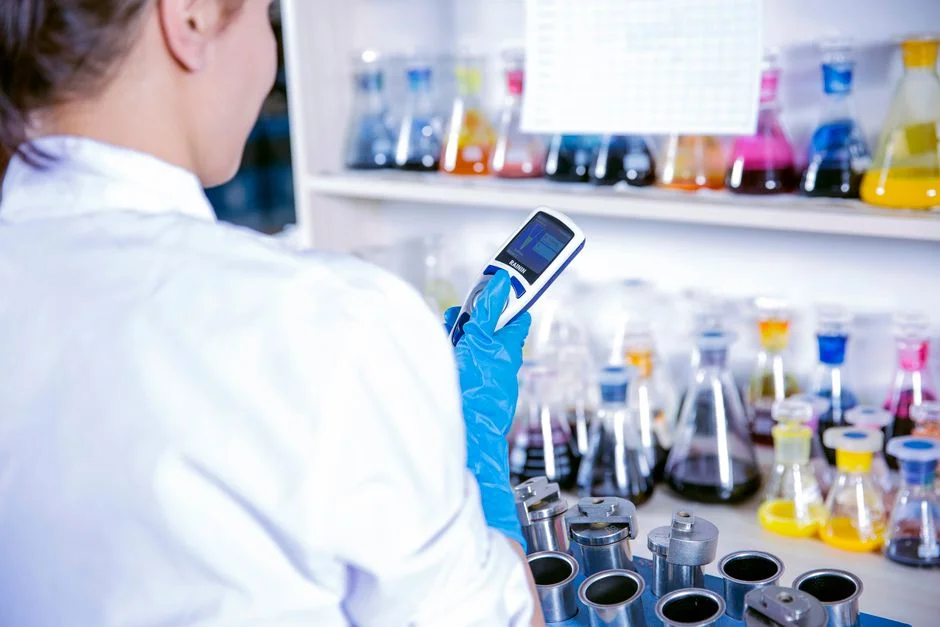
Shortlist the equipment list in the order it appears in the process flow: a GX rotary bar screen at 6 mm aperture for headworks, a dissolved air flotation unit for oil and emulsified carrier removal, the integrated MBR system for the biological stage, an RO skid sized for 75–80% recovery, and a chlorine dioxide generator for any discharge-side disinfection. Add a BOD/COD online analyzer and a conductivity meter on the RO permeate line so compliance reporting against GB 21523-2008 or 40 CFR Part 455 runs automatically — the rationale is laid out in the BOD online monitoring system guide. Lock in a quarterly jar-test protocol for Fenton dose optimization and a monthly membrane CIP cycle, then log both for the local regulator. For procurement shortlisting, the membrane OEM buyer's guide for 2026 and the broader 2026 industrial water reuse trends piece give a defensible supplier shortlist without re-doing the engineering.
Frequently Asked Questions
What influent COD is normal for pesticide manufacturing wastewater? Typical active-ingredient and formulation plants run COD 8,000–25,000 mg/L, ammonia 200–800 mg/L, and color 500–2,000 Pt-Co (HydropureWater field data, 2025–2026). Herbicides tend to sit at the high end; formulation washwater is often weaker but spikier.
Is Fenton oxidation enough to discharge pesticide wastewater? Only for low-strength streams below ~3,000 mg/L COD. Above that, Fenton delivers 40–65% COD reduction and the residual load still needs a biological stage plus RO or ClO₂ polishing to hit GB 21523-2008 or 40 CFR Part 455.
How much does a 500 m³/day pesticide wastewater plant cost in 2026? Turnkey CAPEX runs US$180–$620 per m³/day (US$90k–$310k total for 500 m³/day), with OPEX at US$0.28–$0.65 per m³. Asian EPCs cluster at the low end; EU/US builds sit at the high end.
Which standard governs pesticide wastewater discharge in China, the EU, and the US? China GB 21523-2008 (2024 amendment), EU BREF on Common Waste Water and Waste Gas Treatment in the Chemical Sector (2024), and U.S. EPA 40 CFR Part 455 (2024 amendment). Multinational EPCs typically design to the strictest of the three.
Can pesticide wastewater be reused? Yes. RO polishing after the MBR typically delivers 60–70% reuse for boiler feed or process rinse, with permeate conductivity below 100 µS/cm and meeting EU Directive 98/83/EC and WHO drinking-water values for the parameters of concern.