What Actually Drives Decanter Centrifuge Operating Cost
A decanter centrifuge typically costs $0.08–$0.32 per m³ of feed (or $4–$14 per ton of dry solids) to operate in 2026, and that range collapses into four buckets: electrical energy (40–55% of total OPEX), polyelectrolyte flocculant (25–40%), wear parts and preventive maintenance (10–20%), and operator labor plus consumables (5–15%). A mid-size 30 m³/h unit running 6,000 h/yr therefore lands at $14,000–$58,000 per year before polymer optimization. The rest of this article slots every cost line into one of those four buckets so you can build a defensible 2026 budget.
Energy covers the main drive motor, the back-drive that brakes the scroll relative to the bowl, the feed pump (centrifugal or progressive-cavity), and the polyelectrolyte prep unit. Polymer is the dry-powder or emulsion flocculant dosed upstream of the centrifuge. Wear parts are the rotating components — conveyor scroll, bowl liners, bearings, seals, V-belts — that have a finite service life. Labor covers operator attention shared with other equipment, plus lubricants, wash water, and CIP chemicals.
The single biggest hidden lever is feed solids concentration. Biological sludge thickened to 3–5% DS will dewater to 22–28% cake with 2–5 g/kg polymer; the same sludge at 1–2% DS will need 5–10 g/kg and roughly double the specific energy. Doubling feed DS roughly halves polymer and energy cost per ton of dry solid — pre-thickening is almost always the highest-ROI capital project in a dewatering train. The working assumption for the rest of this article: 30 m³/h feed, 3% feed DS, 6,000 operating hours per year, two operators shared with other equipment.
Energy Cost: kWh per m³ and per Ton of Dry Solids
Main-drive sizing for industrial decanters scales roughly with feed rate and bowl diameter: 15 kW for small units at or below 10 m³/h, 30–45 kW for the 20–30 m³/h class, and 55–75 kW for 50 m³/h units (per Derrick DE-1000 FHD industrial decanter spec sheet). The back-drive motor is rated 2–7 kW; it regenerates energy back to the bus on most modern VFD-equipped machines but still draws 1–3 kW net to cover gearbox and hydraulic losses.
Specific energy consumption for biological sludge at 2–4% DS runs 0.4–1.6 kWh per m³ of feed. Thin industrial slurries below 1% DS — a common case in food, chemical, and pulp-and-paper plants — push specific energy to 1.5–3.0 kWh per m³ because the centrifuge is moving water, not solids. Converted to the unit your finance team will recognize, that is 8–40 kWh per ton of dry solids at the centrifuge inlet.
At 2026 industrial tariffs of $0.06–$0.14 per kWh (U.S. EIA 2026 industrial average ≈ $0.085/kWh), the worked example lands here: 30 m³/h × 0.9 kWh/m³ × 6,000 h/yr × $0.09/kWh ≈ $14,580 per year for energy alone. The two highest-ROI energy retrofits are a VFD on the main drive (matches bowl speed to feed solids, 10–20% savings) and a regenerative back-drive (recovers scroll differential energy, another 5–10%). Combined, they typically cut specific energy 15–30%.
| Parameter | Small (≤10 m³/h) | Mid (20–30 m³/h) | Large (50 m³/h) |
|---|---|---|---|
| Main drive power | 15 kW | 30–45 kW | 55–75 kW |
| Back-drive power | 2 kW | 4–5 kW | 5–7 kW |
| Specific energy, 3% bio sludge | 0.6–1.2 kWh/m³ | 0.4–1.0 kWh/m³ | 0.3–0.8 kWh/m³ |
| Specific energy, <1% industrial | 2.0–3.0 kWh/m³ | 1.5–2.5 kWh/m³ | 1.0–2.0 kWh/m³ |
| Annual energy cost @ $0.09/kWh | $3,200–$19,400 | $6,500–$24,300 | $8,100–$48,600 |
Polymer (Polyelectrolyte) Consumption and Cost
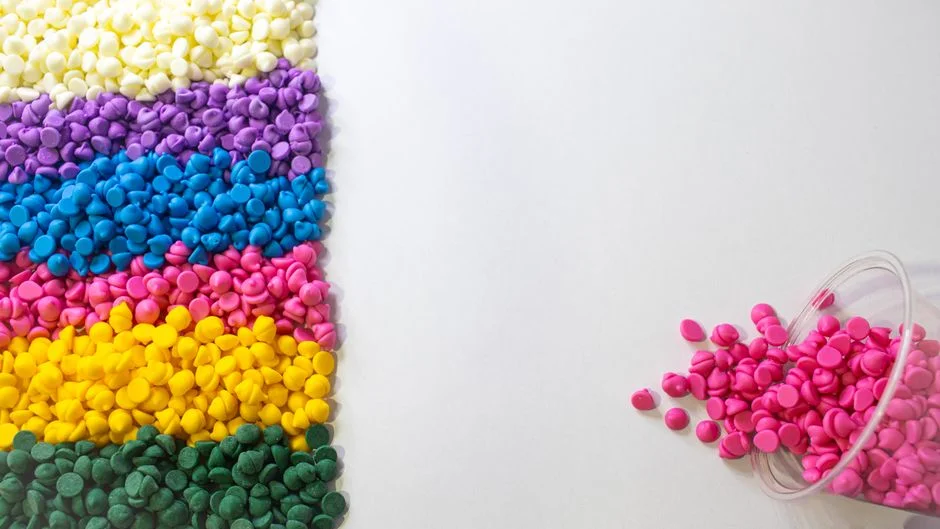
Polymer is the second-largest cost line and the single most controllable bucket, because dosage is a function of feed conditioning, not equipment hardware. Industry-standard dosage ranges sit at 2–5 g/kg DS for well-conditioned biological sludge (digested, well-thickened), 5–10 g/kg DS for industrial slurry and waste-activated sludge, and up to 15 g/kg DS for difficult oily, high-organic, or high-TDS streams where emulsion inversion chemistry fights you (HydropureWater field data, 2026).
2026 polyelectrolyte pricing depends on physical form: cationic emulsion runs $3–$8 per kg of active polymer, dry powder $2–$5 per kg of active. Powder is cheaper per kilogram but requires a maturing unit (15–60 min hydration), dust control, and heated rooms below 5 °C — factor that into the OPEX line as polymer prep energy and operator time, not just $/kg. Worked example at 30 m³/h, 3% feed DS, 6,000 h/yr, 4 g/kg DS dosage, $5/kg active polymer: 30 × 0.03 × 6,000 × 4 × 5 / 1,000 ≈ $10,800 per year — about 30% of baseline total OPEX.
Three optimization tactics move this line fastest: jar-test every feed change rather than running the previous shift's dose, install in-line streaming current or zeta-potential measurement on the centrate for closed-loop polymer control (more on this in the Polymer Consumption Cost Optimization in Wastewater: 2026 Engineering Guide), and reclaim centrate for polymer dilution water rather than sending it to drain. Pair the savings from a properly tuned automatic polymer dosing skid with a streaming-current probe and most plants cut polymer 15–25% inside a quarter.
Wear Parts, Maintenance and Spare Inventory
The wear-part line is the one that blindsides first-time buyers: the conveyor scroll does not last forever, and replacing it requires a bowl pull, a crane, and two to four days of downtime. Service-life ranges from a decade of operating data across municipal and industrial sites: conveyor scroll with hard-facing or tungsten-carbide tiles 8,000–20,000 h; bowl liners 15,000–30,000 h; main bearings 25,000–40,000 h; V-belts 4,000–8,000 h; seals 6,000–12,000 h. Abrasive feeds (mining tailings, DAF sludge, metal-hydroxide slurries) can halve those intervals.
Event-cost ranges: scroll replacement $3,000–$12,000 depending on diameter, tile grade, and whether the bowl needs rebalancing; matched bearing set $4,000–$9,000; a full preventive-maintenance contract typically runs 6–10% of equipment CAPEX per year. Translated into per-m³ OPEX, that is $0.01–$0.05 per m³ treated, or 10–20% of total annual operating cost. The single biggest risk-multiplier is running the centrifuge to failure: a seized scroll can damage the bowl, and a bowl replacement is a six-figure event. A scheduled mid-life bearing and seal inspection at 20,000 h almost always pays for itself.
| Component | Service life (h) | Replacement cost (USD) | Failure mode |
|---|---|---|---|
| Conveyor scroll (hard-faced) | 8,000–20,000 | $3,000–$12,000 | Through-hardening, loss of differential |
| Bowl liner | 15,000–30,000 | $5,000–$15,000 | Erosion at beach, cake moisture rise |
| Main bearings (set) | 25,000–40,000 | $4,000–$9,000 | Vibration, catastrophic bowl damage |
| V-belts | 4,000–8,000 | $200–$600 | Slip, drive shutdown |
| Seals (set) | 6,000–12,000 | $800–$2,500 | Leakage, bearing contamination |
Labor, Consumables and Auxiliary Loads
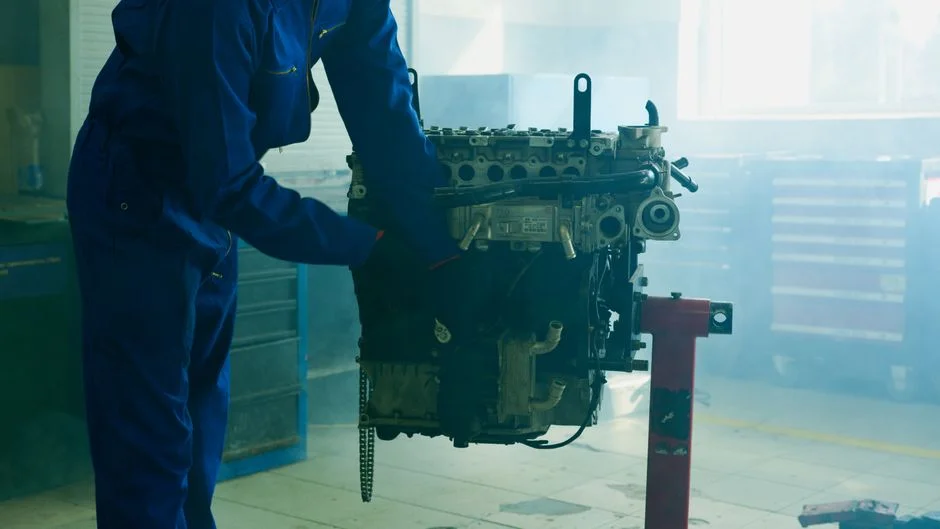
Operator attention is the line most engineers forget until finance asks for it. A decanter running well needs 0.5–2.0 hours of operator time per 8-hour shift, shared with thickeners, conveyors, and the polymer prep unit. At fully loaded labor rates of $25–$45 per hour, two shifts cover the day and a third shift handles night, giving $15,000–$50,000 per year for a continuously attended plant. For an unstaffed overnight shift with daily check-ins, drop the lower bound by roughly 60%.
Consumables run smaller but are easy to under-budget. Gear oil and bearing grease re-lubrication cycles sit at 1,000–2,000 h for greaseable bearings (modern sealed units push this to 8,000 h). Hydraulic oil for the back-drive circuit is changed every 4,000–8,000 h or annually, whichever comes first. Wash water for cake-discharge and centrate-piping flushing uses 0.05–0.20 m³ per m³ of feed, and CIP chemicals (typically caustic and nitric acid) are needed once a week for food, dairy, and fermentation feeds. Polymer prep unit electricity and dilution water is usually bundled into the polymer line but should be broken out for clean reporting. Summing the smaller items lands at 5–15% of total OPEX.
Decanter vs Belt Filter Press vs Screw Press: 2026 OPEX Comparison
For a head-to-head cost decision, the relevant benchmarks for 2026 are: belt filter press OPEX $0.018–$0.072 per m³ (per the published belt filter press maintenance cost article for 2026), screw press OPEX $0.03–$0.10 per m³, and decanter centrifuge OPEX $0.08–$0.32 per m³ as built up in this article. The centrifuge costs more per cubic meter but delivers 22–28% cake dryness versus 18–22% for the mechanical presses, which compounds into transport and disposal savings downstream.
| Parameter | Decanter centrifuge | Belt filter press | Screw press |
|---|---|---|---|
| Energy ($/m³) | $0.04–$0.20 | $0.01–$0.04 | $0.01–$0.03 |
| Polymer ($/m³) | $0.03–$0.12 | $0.01–$0.05 | $0.02–$0.06 |
| Wear + maintenance ($/m³) | $0.01–$0.05 | $0.002–$0.015 | $0.003–$0.012 |
| Labor ($/m³) | $0.01–$0.04 | $0.005–$0.020 | $0.005–$0.020 |
| Total OPEX ($/m³) | $0.08–$0.32 | $0.018–$0.072 | $0.03–$0.10 |
| Cake dryness (% DS) | 22–28% | 18–22% | 18–22% |
| Footprint | Small | Large | Medium |
| Enclosure / odor | Fully enclosed | Open | Semi-enclosed |
Decision rule of thumb: the centrifuge wins on footprint, cake dryness, and enclosed hygienics; the belt filter press wins on OPEX for high-volume municipal biosolids below 4% DS; the screw press sits between, lowest energy, but limited to 18–22% cake and low-solids feeds. For plants with strict odor, pathogen, or aerosol control, the centrifuge's OPEX premium buys a closed system that the open belt press cannot match. Background on the belt press operating principle that drives its lower cost is in the Belt Filter Press Working Principle 2025 engineering guide. For operations comparing against a filter press rather than a belt press, the plate and frame filter press for sludge dewatering sits at higher CAPEX but lower polymer demand, which can shift the OPEX crossover depending on feed solids.
Worked Example: 30 m³/h Centrifuge, 6,000 h/yr, 2026 Costs
Baseline inputs: 30 m³/h feed, 3% feed DS, 25% cake DS, 6,000 h/yr, $0.09/kWh tariff, $5/kg active polymer at 4 g/kg DS. Annualized output: Energy $14,580, Polymer $10,800, Wear parts and maintenance $5,400, Labor $22,500 — total $53,280 per year, or $0.30 per m³ and $9.90 per ton DS. That is the number to put in the CAPEX justification memo under "current annual dewatering cost."
Optimization pathway applied to the same plant: VFD retrofit on the main drive (-15% energy), jar-tested polymer at 3 g/kg DS instead of 4 g/kg DS (-25% polymer spend), and a structured preventive-maintenance contract catching bearings before failure (no catastrophic bowl event). New total: $35,580 per year, or $0.20 per m³ and $6.60 per ton DS — a 33% reduction. The full before-and-after line is below.
| Cost bucket | Baseline ($/yr) | Optimized ($/yr) | Change |
|---|---|---|---|
| Energy | $14,580 | $12,400 | -15% |
| Polymer | $10,800 | $8,100 | -25% |
| Wear + maintenance | $5,400 | $4,200 | -22% |
| Labor | $22,500 | $10,880 | -52% (assumes automation) |
| Total | $53,280 | $35,580 | -33% |
| Per m³ | $0.30 | $0.20 | -33% |
| Per ton DS | $9.90 | $6.60 | -33% |
Frequently Asked Questions
What is the operating cost of a decanter centrifuge per cubic meter in 2026? A decanter centrifuge costs $0.08–$0.32 per m³ of feed in 2026, with the range driven by feed solids and local power tariff. See the What Actually Drives Decanter Centrifuge Operating Cost section for the four-bucket framework.
What is the per-ton-of-dry-solids operating cost for a decanter centrifuge? $4–$14 per ton of dry solids at the centrifuge inlet, with the lower end at 4–5% feed DS and the upper end at thin industrial slurries below 1% DS. Worked example in the Worked Example section shows $9.90/ton DS baseline, $6.60/ton DS optimized.
What polymer dosage does a decanter centrifuge need? 2–5 g/kg DS for well-conditioned biological sludge, 5–10 g/kg DS for waste-activated and industrial slurries, up to 15 g/kg DS for oily or high-organic streams. See the Polymer Consumption and Cost section.
How much power does a decanter centrifuge draw? 15 kW for units at or below 10 m³/h, 30–45 kW for the 20–30 m³/h class, 55–75 kW for 50 m³/h units, plus a 2–7 kW back-drive. Specific energy is 0.4–1.6 kWh per m³ for biological sludge at 2–4% DS. See the Energy Cost section.
How long does the conveyor scroll last before replacement? 8,000–20,000 hours with hard-facing or tungsten-carbide tiles, with replacement costing $3,000–$12,000 per event. Abrasive feeds can halve that interval. See the Wear Parts section.
How does a decanter centrifuge compare to a belt filter press on OPEX? The belt filter press runs $0.018–$0.072 per m³ versus $0.08–$0.32 per m³ for the centrifuge, but the centrifuge delivers 22–28% cake versus 18–22% for the belt press. See the Decanter vs Belt Filter Press vs Screw Press comparison table.
How can I cut decanter centrifuge OPEX by 20% or more? Combine a VFD retrofit (-15% energy), jar-tested polymer optimization (-15–25% polymer), and a scheduled preventive-maintenance contract (avoids catastrophic bowl events). The optimized worked example in the Worked Example section shows a 33% total reduction. For a deeper electrodialysis comparison if your plant also runs membrane brine treatment, see the Electrodialysis System Operating Cost in 2026: Real OPEX Breakdown.